
Demo Wizard is the Ultimate Store Sampling & Demonstration management software for Brick and Mortar Retailers and CPG Vendors.
Chat with us

Phone
Copyright © 2026 Demo Wizard

Retail analytics software collects, processes, and visualizes sales, inventory, foot traffic, and customer data so retailers can make faster, more profitable decisions. It connects to POS, ERP, and inventory systems to turn raw transaction data into actionable insights, from demand forecasting to promotion performance. Modern platforms range from descriptive dashboards to AI-driven prescriptive engines that recommend specific actions, with pricing typically starting around $500/month for SMBs and scaling into six figures for enterprise deployments.
Retail analytics software aggregates data from POS, ERP, inventory, and foot-traffic systems into a unified layer that turns raw transactions into decisions.
That distinction, unified layer, not just dashboard, matters. Many tools display data. A dedicated retail analytics platform connects source systems, normalizes inconsistent formats, and surfaces patterns across stores, time periods, and product categories that no single system could show alone.
The four problems retailers cite most often are stockouts from poor demand forecasting, wasted trade promotion spend, slow markdown decisions, and low in-store demo ROI. Each one costs measurable margin. According to Improvado's 2026 analysis, retailers commonly waste $50,000 per year on analytics tooling that doesn't address the right problem [2].
Trade promotion spend is a particular blind spot. Brands run dozens of in-store activations monthly without knowing which store locations or time slots actually converted shoppers to buyers. That visibility gap is exactly what platforms built around in-store activation data, including Demo Wizard, which tracks experience-to-purchase conversion rates by store and time period, are designed to close.
Slow markdown decisions compound the problem. By the time a merchandising team identifies an inventory issue, the margin has already eroded [1].
The data pipeline runs in three steps: ingestion, processing, and visualization. Ingestion pulls from POS terminals, ERP systems, loyalty programs, and increasingly, demo and event data. Processing normalizes that data, reconciling different date formats, SKU naming conventions, and store codes. Visualization and alerting then surface the output as dashboards, exception reports, or automated alerts.
Integration depth separates platforms sharply. Tools with native connectors to Square, NCR, and Lightspeed go live faster and require less internal engineering. Platforms without those connectors push the burden onto custom ETL work, which Improvado estimates costs between $20,000 and $80,000 in data engineering alone [2].
In-store activation data, demo sales, ambassador performance, conversion rates by location, is a growing input source that most legacy retail analytics platforms underserve. That gap leaves brands managing activation results in spreadsheets, disconnected from the broader analytics picture.
"Retailers that integrate in-store activation data with their core analytics stack consistently outperform those that manage demo results in isolation — the visibility gap is where margin gets lost." — Dr. Kirthi Kalyanam, Director of the Retail Management Institute at Santa Clara University
Retail analytics tools fall into four capability tiers, descriptive, diagnostic, predictive, and prescriptive, each answering a progressively harder business question.
Descriptive analytics answers "what happened." A typical output is last week's sell-through rate by SKU across every store, useful for reporting but not for action.
Diagnostic analytics answers "why did it happen." If a promoted item underperformed in the Southwest region, diagnostic tools surface the cause: a competing promotion, a planogram gap, or low ambassador coverage on key weekends.
Predictive analytics answers "what will happen." Forecasting stockout dates by store is a standard example, and the stakes are real. According to McKinsey's retail research, predictive inventory models can reduce carrying costs by 10–30%, which is why the type of analytics a platform offers matters as much as the platform itself.
Prescriptive analytics answers "what should we do." It outputs recommended reorder quantities, optimal promotional windows, and, critically for CPG brands, which stores, days, and ambassador profiles produce the highest experience-to-purchase conversion rates. Demo Wizard handles this natively: its post-demo performance data identifies high-converting store and time combinations so coordinators act on evidence, not instinct.
Most SMB-tier platforms in 2025–2026 offer only descriptive and diagnostic capabilities. Prescriptive analytics remains largely an enterprise feature, though AI agent tools like ThoughtSpot Spotter [1] are pushing this tier toward mid-market buyers.
Store traffic analytics tracks footfall volume, dwell time by zone, and conversion rate, the share of visitors who actually purchase. These three metrics together reveal where a store loses customers and why.
In-store demo events directly lift all three. A sampling activation increases dwell time in the product zone, concentrates foot traffic near the display, and raises the zone's conversion rate during the event window. Measuring that lift, before, during, and after the demo, is how brands prove incremental sales impact to retail partners rather than relying on anecdotal feedback.
"The retailers winning on analytics aren't necessarily those with the most data — they're the ones who've built a tight loop between insight, field execution, and measurement. Closing that loop is what separates analytics investment from analytics theater." — Barbara Kahn, Patty and Jay H. Baker Professor of Marketing at The Wharton School, University of Pennsylvania
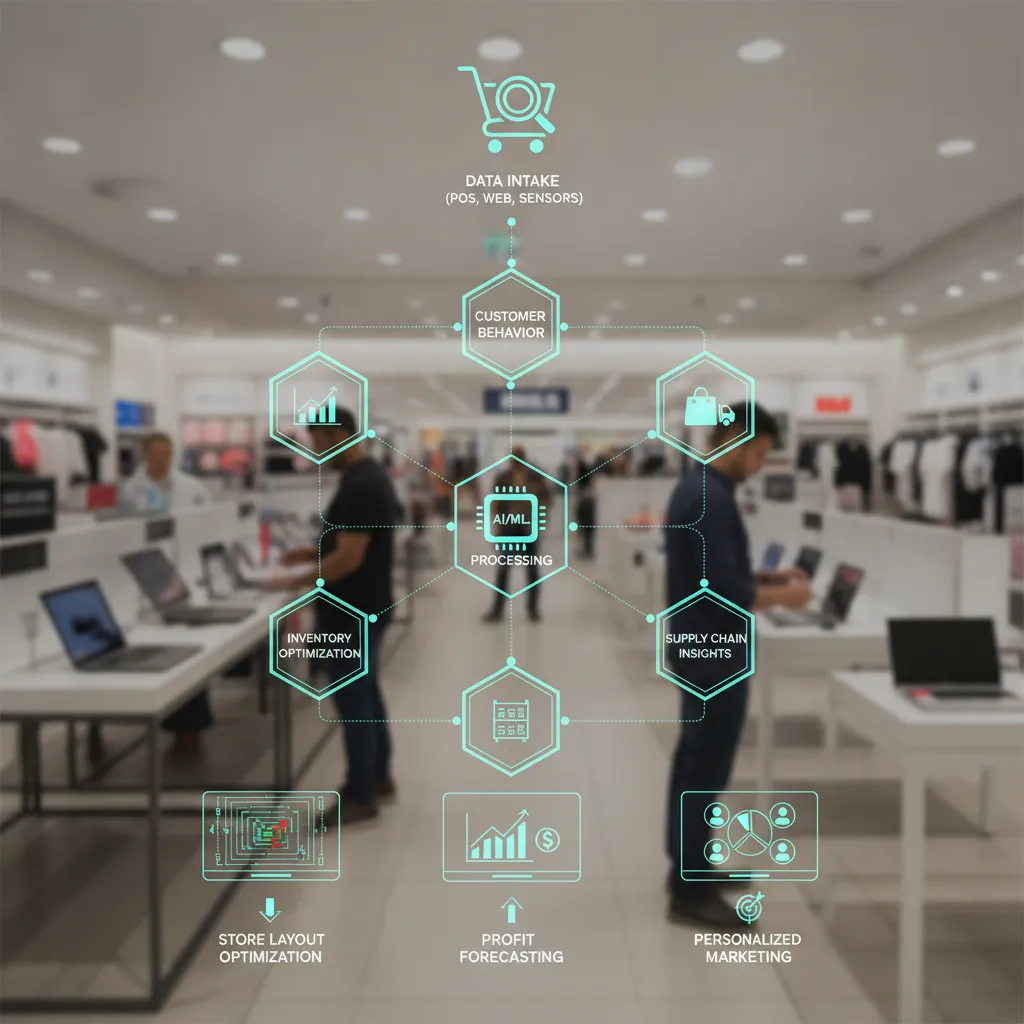
The right analytics platform depends on your revenue scale, integration requirements, and total budget, not just the license fee.
Retail analytics platforms typically deliver measurable ROI only when annual retail revenue exceeds roughly $5M [2]. Below that threshold, data volume is too low and implementation costs too high to justify enterprise-grade tooling.
Brands under $5M are better served by purpose-built, lighter-weight solutions. A tool focused on demo ROI tracking, like Demo Wizard, which measures experience-to-purchase conversion rates at the store level, delivers actionable data without the overhead of a full analytics deployment.
License fees represent only 30–40% of the real cost of a retail analytics platform [2]. The remainder covers data integration work, staff training, and ongoing governance, costs that compound over time and are rarely quoted upfront.
Implementation timelines vary significantly by platform type. Cloud-native SaaS tools such as ThoughtSpot deploy in 4–12 weeks [2]. On-premise or heavily customized solutions like Oracle Retail or Aptos run 6–18 months [2], a meaningful operational gap for mid-market teams.
Before signing any contract, get a written integration scope. A platform that doesn't connect natively to your POS or trade promotion management system will require custom middleware, adding $20,000–$80,000 in data engineering costs [2].
According to the National Retail Federation's technology research, data governance is among the top three implementation challenges retailers face when deploying analytics platforms. Run through this data governance checklist with every vendor:
ThoughtSpot, Aptos, and Oracle dominate enterprise-grade retail analytics, but each targets a different budget, team size, and deployment timeline.
ThoughtSpot (Spotter) uses a natural-language query interface, so merchandisers can ask questions without writing SQL. It starts at roughly $95/user/month [2], deploys on cloud infrastructure, and suits mid-market to enterprise retailers without a dedicated BI team. Retail deployments typically show a 3–6 month payback period [1].
Aptos Analytics is purpose-built for retail, with a 45-year retail data model covering merchandise planning and store operations [3]. Annual contract values run $150K–$500K+, and implementation takes 9–12 months. The depth of the data model is a genuine differentiator—but it comes at enterprise cost and timeline.
Oracle Retail Analytics offers the deepest ERP integration for retailers already running Oracle systems. It carries the highest total cost of ownership in the category [2], deployments run 12–18 months, and it is best suited for retailers with $500M+ revenue and a dedicated IT team to manage it.
Repsly focuses on field execution and retail activity analytics, starting at roughly $99/user/month. It deploys in weeks and is strongest for CPG brands tracking in-store reps and demo activity. On brand ambassador analytics it overlaps with Demo Wizard, but it lacks integrated demo scheduling and payroll processing.
Oracle and Aptos both require months of IT work and significant data engineering investment before a single dashboard goes live [2]. ThoughtSpot and Repsly are faster, but neither was built to manage the full activation workflow—scheduling, ambassador payroll, and post-demo conversion tracking in one place.
Demo Wizard fills that gap. At $3 per demo, a single coordinator can schedule hundreds of monthly events, manage ambassador assignments, and pull store-level ROI data without a six-figure implementation budget or a BI team standing by.
Most retail analytics implementations fail not because the software is wrong, but because the team skips the groundwork that makes data usable in the first place.
Six failure patterns account for the majority of abandoned deployments. The first is starting without a defined decision use case, "we'll figure out what to do with the data later" is not a strategy. The second is underestimating data cleaning, which typically consumes 40–60% of total implementation effort [2]. Third: no executive sponsor, which means the project stalls when cross-department cooperation is needed.
The fourth failure is buying enterprise features an SMB team can't operationalize, 11,000 pre-built metrics [3] are worthless if your team of three can act on only a dozen. Fifth is ignoring change management; dashboards no one opens produce no value. The sixth, and most costly, is failing to close the loop between insight and field execution.
That last gap is where many analytics platforms fall short. Analytics only creates value when insights reach the people running activations: brand ambassadors, field reps, and coordinators. Platforms that don't connect insight to scheduling to execution to reporting leave measurable ROI on the table. Demo Wizard addresses this directly by routing post-demo conversion data back into scheduling decisions, so coordinators reallocate budget toward high-performing stores rather than filing reports no one acts on.
A CPG brand running 200 monthly demos that adds post-demo analytics tracking can identify its top 20% of stores by conversion rate. Reallocating demo budget to those stores alone typically produces a 15–25% revenue lift on the same spend.
Set these targets before go-live so you have a baseline to measure against: a 5–15% reduction in stockout rate within 90 days, a 10–20% improvement in promotion ROI within two quarters, and measurable lift in in-store demo conversion rate, well-executed demos benchmark at 20–35% experience-to-purchase conversion.
A practical first-90-days roadmap keeps implementation on track:
That first closed loop, even a small one, is what separates implementations that stick from those that get abandoned by month four [2].
Retail analytics software is built around retail-specific data models, store traffic, SKU-level sell-through, planogram compliance, and promotion lift, while a general BI tool requires your team to build those models from scratch. A platform like Tableau or Power BI can visualize any data you feed it, but it ships with no retail context. Dedicated retail analytics tools come pre-loaded with KPIs relevant to merchandising, inventory, and in-store performance, which cuts setup time significantly. Aptos Analytics, for example, ships with 11,000 pre-built retail metrics [3].
Most dedicated retail analytics platforms are not worth the investment below $5M in annual revenue [2]. At that scale, the licensing fees, data engineering costs, and implementation time typically outweigh the gains. Smaller retailers are better served by their POS system's built-in reporting, a spreadsheet-based dashboard, or a lightweight tool that tracks one or two key metrics, such as conversion rate per store location, without requiring a full data infrastructure.
Most mid-market retailers see measurable ROI within three to six months of full adoption, assuming clean data inputs and consistent use by the team. Enterprise platforms with complex integrations can take longer, Aptos Analytics targets 60 to 90 days to go live [3], but that's go-live, not payback. The fastest ROI typically comes from catching a single costly problem early, such as a stockout pattern or a low-converting promotion, before it compounds.
Most retail analytics platforms connect to point-of-sale systems, inventory management software, e-commerce platforms, loyalty program databases, and supplier or distributor feeds. More advanced tools also pull in foot traffic data, weather overlays, and promotional calendars. The quality of your analysis depends directly on the completeness and cleanliness of these source systems, a platform can only surface insights from data that has actually been captured and structured correctly.
In-store demo analytics fills a specific gap that most retail analytics platforms ignore: the direct link between a physical brand interaction and an immediate purchase decision. While your core retail analytics platform tracks aggregate sales and inventory, demo-level data shows which store locations, time slots, and brand ambassadors drive the highest experience-to-purchase conversion rates. Demo Wizard, for instance, generates post-demo performance reports by store and time period, giving CPG brands a granular ROI signal they can use to allocate future activation budgets toward the highest-converting locations.
Retail analytics software earns its place when it connects data to a decision your team can actually act on, whether that's pulling a slow SKU, shifting a promotion budget, or doubling down on a store that consistently over-indexes on sales. The platforms that deliver the most value are those matched to your revenue stage, data infrastructure, and the specific questions your team asks every week.
Three things worth acting on: audit which decisions in your business currently rely on gut instinct rather than store-level data; confirm your POS and inventory systems are clean enough to feed a new platform; and if you run in-store demos, start tracking conversion rates by location rather than treating all activations as equal. To see what demo-level ROI tracking looks like in practice, request a walkthrough of Demo Wizard's post-demo analytics dashboard at demo-wizard.com.
Demo Wizard is the Ultimate Store Sampling & Demonstration management software for Brick and Mortar Retailers and CPG Vendors.
Chat with usPhone