
Demo Wizard is the Ultimate Store Sampling & Demonstration management software for Brick and Mortar Retailers and CPG Vendors.
Chat with us

Phone
Copyright © 2026 Demo Wizard
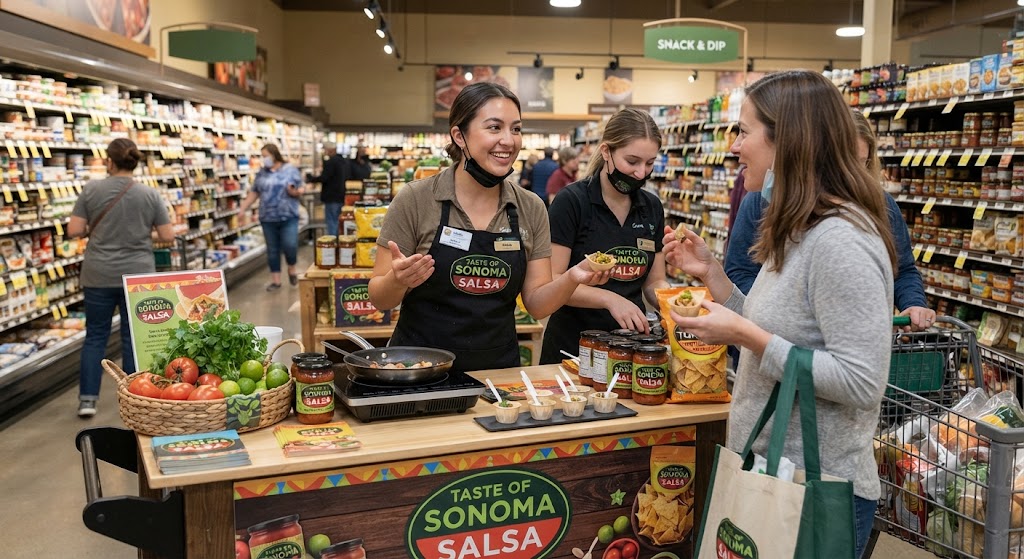
Repeat purchase rate sampling is the practice of measuring what share of customers buy again within a defined time window, using a sample of transaction data rather than a full population count. It matters because the sample's size, timeframe, and customer mix determine whether the resulting rate is a reliable signal or a misleading average. Repeat purchase rate differs from repeat customer rate in what gets counted: one measures purchases, the other measures unique customers, and mixing the two definitions is a common sampling error.
Repeat purchase rate counts orders, not people: it's the share of all transactions in a window that come from accounts who already purchased before. Repeat purchase rate sampling applies that order-level definition to a subset of transaction data rather than the full ledger, which is why the sample's construction determines whether the number means anything.
Repeat customer rate answers a different question. It counts unique buyers who purchased at least twice in a period, regardless of how many orders each one placed [3]. A single loyal customer who buys weekly inflates repeat purchase rate far more than repeat customer rate, because the first metric weights by transaction and the second weights by person. Blend the two definitions in one sample and the resulting figure will not match either metric cleanly, a common error when brands pull data from mixed reporting sources without checking which definition each source used [1]. For a closer look at how this metric is defined and calculated, VisionLabs' overview of repeat purchase rate walks through the formula and common variations.
Purchase cadence differs structurally across these models, so a sampling window built for one will misread another. A B2B distributor might reorder on a 60- or 90-day cycle tied to inventory drawdown, a subscription service repurchases on a fixed billing date almost by definition, and a B2C grocery shopper's repurchase timing depends on the product category, weekly for perishables, monthly or longer for household goods. Applying a 30-day sampling window across all three will undercount B2B and subscription repeat rates while potentially overcounting fast-turnover grocery categories.
A repeat customer's definition, second purchase versus third, same SKU versus any SKU in the brand's line, changes what the sample actually measures. A sample built around "bought the same SKU twice" will show a lower rate than one counting "bought anything from the brand twice," even when pulled from identical transaction data. For CPG brands evaluating in-store sampling programs, this matters directly: a shopper who samples a new flavor and later buys a different SKU in the line still represents a real repeat purchase, but only if the sample's cohort definition allows any-SKU credit.
Repeat purchase rate equals the number of customers who bought more than once divided by total customers in a given period, then multiplied by 100 for a percentage [1].
The formula is straightforward: repeat customers ÷ total customers in the period [1]. Suppose a CPG brand samples 500 shoppers during an in-store demo campaign over 90 days, and 140 of them buy the product a second time within that window. The repeat purchase rate is 140 ÷ 500, or 28 percent.
That number only means something if the underlying sample reflects the real customer base, not just the shoppers who happened to be tracked, or the stores that had the strongest ambassador coverage. This is where repeat purchase rate sampling decisions start to matter as much as the arithmetic itself.
The window you pick changes the answer, sometimes dramatically. A 30-day window catches only fast-cycle categories, snacks, beverages, personal care items people restock weekly. A 365-day window is necessary for categories like specialty condiments, seasonal beverages, or premium household goods, where a customer might genuinely love the product but not need to rebuy for months.
Defaulting to a 90-day calendar quarter because it's convenient for reporting is a common mistake. If your category's natural repurchase cycle is 120 days, a 90-day window will understate repeat behavior and make a successful sampling campaign look weaker than it is.
Three biases distort repeat purchase numbers most often. Survivorship bias inflates the rate when you only track customers who stayed reachable or engaged, dropping those who churned silently. Seasonal skew happens when a sample is drawn entirely from a holiday push or back-to-school period, making repurchase look stronger, or weaker, than it is the rest of the year.
Channel mix skew is the one CPG brands miss most: a sample weighted toward high-traffic urban stores or a single retail banner won't represent performance across a full multi-region footprint. When brands run in-store demos through Demo Wizard's ROI tracking across many locations, comparing store-level and time-period data side by side helps catch this kind of skew before it distorts a campaign's reported success.
There is no single "good" repeat purchase rate (RPR), the right benchmark depends on your product category, purchase cycle, and how customers first found you.
A shelf-stable snack brand and a premium skincare line will post very different numbers, and both can be healthy. Comparing either to a generic industry average produces a benchmark that misleads more than it informs. Geckoboard's collection of customer retention KPI examples illustrates just how differently this metric can be framed depending on the business model being measured.
Perishable food and beverage products get consumed and replaced on a short cycle, a coffee, snack, or beverage brand should expect faster repeat cycles than a durable goods company selling kitchen appliances or home fitness equipment. Durable goods buyers might not return for a year or more, which makes a 90-day repeat window meaningless for that category even though it works fine for grocery staples.
Acquisition channel shifts the sample just as much as category does. A customer who found your product through a paid social ad behaves differently than one referred by a friend or one who tried a sample at a retail demo table. Paid-acquisition customers tend to show lower repeat rates because the ad, not genuine product fit, drove the first purchase. Referral customers usually repeat at higher rates because someone they trust already vetted the product. In-store trial converts, the people who tasted or tested a product at a demo and then bought it, represent a distinct group again, since the first purchase followed direct product experience rather than a message or discount. Blending these groups into one repeat purchase rate sampling exercise hides which acquisition source is actually building a loyal customer base.
A repeat purchase rate calculator works mechanically the same way regardless of the platform behind it: it pulls order history for a customer set, applies a defined time window, and divides repeat customers by total customers to output a percentage [1]. The output is only as trustworthy as the window and segment you feed into it.
Because external benchmarks vary so much in methodology, different windows, different definitions of "repeat," different customer mixes [3], the most defensible comparison is your own brand's trailing performance. Track your rate quarter over quarter, by channel and by SKU, and treat that historical baseline as your benchmark rather than an industry figure pulled from a different category entirely.
Repeat purchase rate, retention rate, purchase frequency, and lifetime value answer different questions, and a repeat purchase rate sampling program only proves its worth when you read the metrics together, not in isolation.
Repeat purchase rate measures the share of buyers who make a second transaction at any point, with no fixed billing cycle attached [1]. Retention rate, by contrast, applies most cleanly to subscription or contract businesses, where a customer is either retained or lost at each renewal period. A grocery shopper who buys a sampled snack brand twice in six months boosts repeat purchase rate; retention rate has little meaning here because there is no contract to renew.
A customer counted in your repeat purchase rate might buy again once a year or once a month, purchase frequency is what separates those two cases. For a CPG brand running in-store sampling, frequency reveals whether a demo created a habitual buyer or a one-time curiosity purchase.
Lifetime value multiplies repeat purchase behavior by average order value and margin, which means a high repeat purchase rate can still produce weak lifetime value if repeat buyers only ever purchase a low-margin single unit. A sampling campaign that drives loyal buyers toward a small, low-cost travel-size item generates a very different lifetime value than one that converts shoppers to a full-size, higher-margin SKU.
Treat repeat purchase rate as one input in a small dashboard alongside frequency, average order value, and lifetime value, not a standalone score. Brands and demo agencies evaluating sampling ROI should pull all four before deciding whether a campaign, store, or SKU deserves more budget.
Repeat purchase rate improves when the first transaction delivers on its promise, everything after that is reinforcement, not repair.
The first purchase (or first trial) sets the ceiling for every metric that follows. If a shopper's initial experience with a product falls short, wrong flavor, poor texture, confusing instructions, a stockout that forces a substitute, no email campaign or loyalty point system recovers that. This is why product performance and onboarding quality matter more to repeat purchase rate than most post-purchase tactics combined. For physical goods sold in stores, that first experience often happens at a sampling table, not at checkout.
The mechanism differs by model, so the fix does too.
Transactional B2C (retail, ecommerce): Reduce friction on the second purchase, easy reorder, consistent stock, fast fulfillment, and make sure the product matched expectations set at first purchase.
Subscription models: Repeat purchase rate is churn prevention. Usage-based check-ins, renewal reminders before a billing cycle, and proactive outreach when engagement drops are the relevant touchpoints, not sampling.
B2B: Repurchase triggers are account-based, contract renewal dates, usage thresholds, or a customer success check-in tied to the account's purchase cycle, not a single shopper's decision.
For CPG brands sold in grocery and mass retail, the highest-use lever is different from all three above: in-store sampling. Letting a shopper taste a sauce, smell a detergent, or try a skincare product before buying removes the risk of a first purchase entirely. That's a distinct mechanism from email or loyalty tactics, it acts before the first sale, not after it. This is the core logic behind repeat purchase rate sampling: a well-run demo converts trial into a first purchase with less perceived risk, which raises the odds of a second and third purchase down the line.
The harder question is which demos actually produced that downstream repeat behavior. A brand running monthly demos across a dozen states needs to know which stores, dayparts, and ambassador teams drove buyers who came back, not just which events had good foot traffic on the day. This is where Demo Wizard's role is narrow but useful: it schedules and tracks in-store demo events and reports experience-to-purchase conversion by store and time period, giving activation managers the data to shift budget toward the locations and formats that produced repeat buyers, rather than just first-time samplers.
No, they measure related but distinct things: repeat purchase rate counts customers who bought more than once, while retention rate tracks whether existing customers continue buying over a defined period [1]. Retention rate typically accounts for churn within a cohort, whereas repeat purchase rate is a simpler count of repeat versus one-time buyers [1].
Most small businesses should start with a 90-day or 12-month window, depending on how often customers naturally reorder. A grocery or CPG brand with fast-turnover products (snacks, beverages) should use a shorter window than a business selling durable goods, since purchase cycles differ by category.
Differences usually come from how each company defines the customer count and the time window used [3]. Some divide repeat customers by total customers in a period; others divide by first-time buyers only. Geckoboard notes there's no universal time limit for what counts as a repeat customer [3], so a one-year gap between purchases still counts for one business but not another.
Sampling can increase repeat purchase rate when it's paired with tracking that connects the demo event to later purchases, not just immediate sales. A brand that samples in high-traffic stores at peak hours, then checks whether shoppers return to buy again, gets a clearer read than one that only counts units moved during the event. Platforms like Demo Wizard report experience-to-purchase conversion by store and time period, which helps brands isolate which activations actually build repeat buyers rather than one-time trial.
Yes, a fast-growing business can show a falling repeat purchase rate even as loyalty improves, simply because new customers are diluting the ratio. A surge of first-time buyers from a new store launch or expanded distribution will always lower the percentage in the short term, regardless of how well those customers are actually retained.
Repeat purchase rate only tells a useful story when it's measured consistently and tied to the activity meant to influence it. Pick a time window that matches your category's buying cycle, keep the formula stable across reporting periods, and separate one-time trial from genuine repeat behavior before crediting a sampling campaign. For CPG brands running in-store demos across many locations, the next step is straightforward: pull your last quarter's demo schedule and cross-check which stores and time slots produced buyers who came back, not just buyers who showed up once.
Explore more from our content library:
About the Author
Written by the SaaS / Retail Marketing Technology experts at Demo Wizard. Our team brings years of hands-on experience helping businesses with SaaS / Retail Marketing Technology, delivering practical guidance grounded in real-world results.
Demo Wizard is the Ultimate Store Sampling & Demonstration management software for Brick and Mortar Retailers and CPG Vendors.
Chat with usPhone