
Demo Wizard is the Ultimate Store Sampling & Demonstration management software for Brick and Mortar Retailers and CPG Vendors.
Chat with us

Phone
Copyright © 2026 Demo Wizard

Demo performance analytics means tracking what happens before, during, and after an in-store product demonstration to prove its impact on sales and justify the investment. For CPG brands, this connects sampling activity to hard numbers: units sold per hour, lift versus non-demo days, cost per demo, and conversion from sample to purchase. Without it, brands are guessing whether a demo program is worth renewing, which stores to prioritize, or which brand ambassadors drive results.
Demo performance analytics is not a product category you buy off a shelf, it is the practice of connecting what happened during a demo to what happened at the register afterward. Attendance, timing, execution quality, and sales lift only mean something when they are tied together and reviewed as one dataset, not four separate reports.
A brand ambassador handing out samples on a Saturday afternoon generates a specific set of facts: how many shoppers stopped, how many units moved, how long the table was staffed, and what the store sold that same day compared to a normal Saturday. Demo performance analytics is the discipline of linking those facts together so a brand activation manager can answer a direct question, did this demo pay for itself?
Media impressions and shelf placement measure exposure over weeks or months across an entire market; demo data has to be measured in hours, at a single address.
A digital ad campaign or an endcap placement runs continuously and its impact blends into general sales trends, making it hard to isolate. A demo is different: it is staffed for a fixed window, at one store, by one or two ambassadors. That narrowness is an advantage for measurement, not a limitation, it means a brand can compare demo-day sales directly against a non-demo baseline at the same store, rather than estimating influence across a broad campaign footprint.
The data only matters if it feeds decisions that affect budget and shelf space, not just a report that sits in a folder.
The stakes climb further with roadshows and pop-up activations. A multi-day roadshow involves larger inventory commitments, bundled offers, and dedicated floor space, so a measurement error costs more than it would on a single sampling table. Platforms like Demo Wizard address this by tying store-level and time-period performance data directly to ROI reporting, so a coordinator managing hundreds of monthly events across markets can see which locations and formats justify the investment without reconciling spreadsheets by hand.
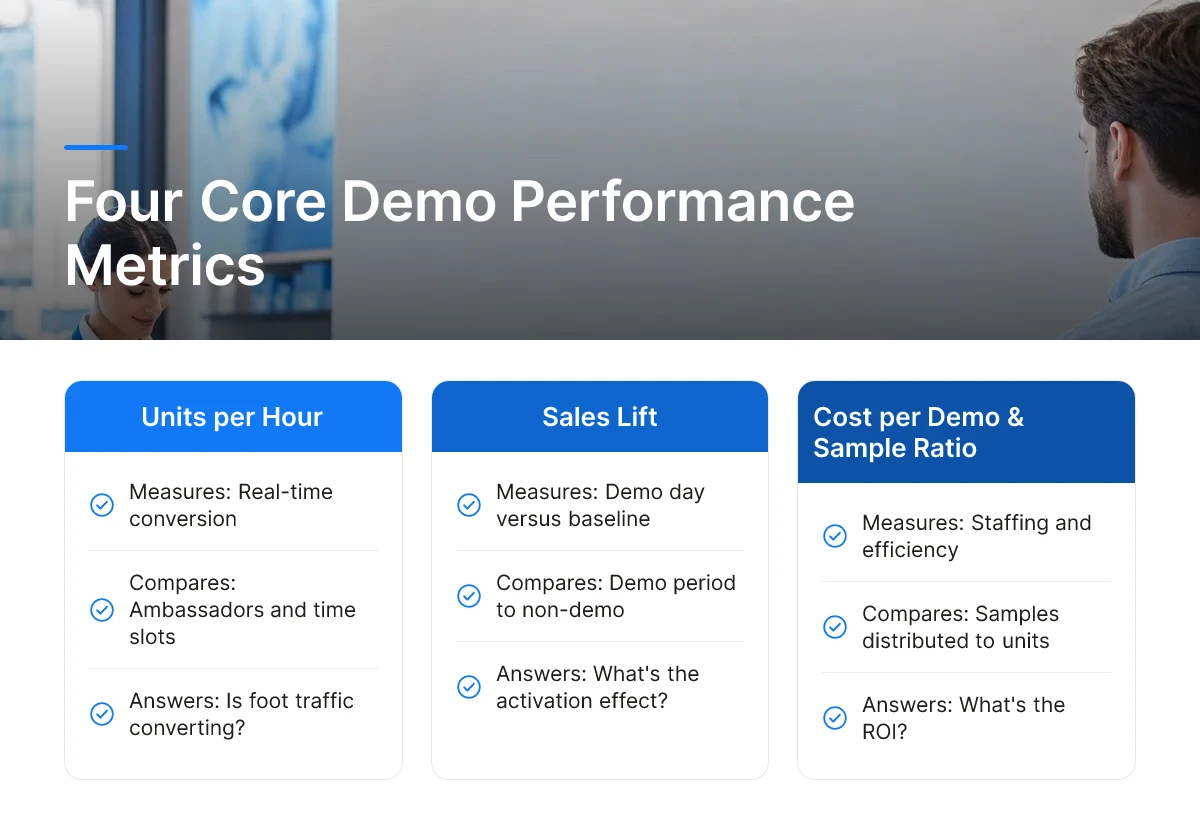
Four numbers anchor any credible demo performance analytics program: units sold per hour during the demo window, sales lift versus a baseline period at the same store, cost per demo, and samples distributed against units sold.
Each metric answers a different question. Units per hour tells you whether the activation is converting foot traffic in real time, useful for comparing ambassadors or time slots against each other. Sales lift, calculated by comparing the demo day's velocity to a recent non-demo period at that same store, isolates the activation's effect from normal seasonal or promotional noise. Cost per demo, staffing, product cost, and materials like tables, signage, or trays, turns raw sales into a margin conversation finance teams can actually approve. Samples distributed versus units sold gives you a rough trial-to-purchase ratio, which matters most for new-item launches where the goal is conversion, not just volume.
Most demo programs cannot track an individual shopper from sample to checkout, so conversion gets measured by comparing aggregate point-of-sale data, not individual baskets.
The standard approach pulls POS velocity for the SKU during the demo window and compares it against one of two baselines: the same store's sales in a comparable prior period, or a similar non-demo store in the same chain and region. The gap between the two is your attributed lift. This is directional, not exact, weather, local promotions, and competitor activity can all move the number, but it's the closest most brands get without a loyalty-card-level data feed from the retailer, which few small and mid-market CPG brands have access to. Industry data suggests sampled products often see substantially higher sell-through than non-sampled items during the activation window [2], which is why isolating that lift by store and day matters more than a single national average.
A complete ROI picture requires operational data from demo staff and sales data from the retailer, and neither side can produce it alone.
From ambassadors, you need check-in and check-out times, the number of samples actually used versus what was allocated, setup photos for compliance review, and notes on recurring shopper objections, the qualitative signal that explains why a number moved. From the retailer, you need POS data for the demo window and surrounding days, plus inventory counts to confirm the product was in stock and merchandised correctly throughout the activation. A platform like Demo Wizard pulls both sides into one dashboard so a coordinator isn't reconciling ambassador timesheets against a separate retailer sales report by hand.
Roadshows add another layer. Because these multi-day, high-footprint activations often sell exclusive bundles or bulk pack sizes not carried on standard shelves, sell-through rate on those specific SKUs, and how fast the staged inventory depletes, becomes the leading indicator of whether the event is working, sometimes visible within the first day of a weekend run.
Reliable demo performance analytics depend on connecting scheduling, in-store check-ins, and reporting into one system rather than stitching together data after the fact.
Most brands start with what's easy: an ambassador texts a photo, fills out a paper log, or emails a spreadsheet at the end of a shift. That works for five stores. It falls apart at fifty. Once a program spans multiple regions, someone on the brand side ends up manually reconciling formats, different spreadsheet columns, missing timestamps, photos scattered across text threads, before anyone can answer a simple question like "which stores sold the most units last weekend." That reconciliation work is a real bottleneck, and it's the reason many CPG teams can describe a single demo in detail but can't produce a reliable rollup across a campaign.
Three pieces need to connect: a scheduling and coordination system that assigns ambassadors to stores and times, a check-in mechanism tied to that specific store location and shift, and a reporting layer that brand managers, retailers, and agencies can all view without requesting a separate export. When these run as separate tools, one for scheduling, one for timekeeping, one for reporting, someone has to manually match records across all three, and errors creep in every time a shift changes or a store substitutes an ambassador last minute. Demo Wizard addresses this by tying scheduling, ambassador deployment, and post-demo analytics into one system, so a check-in at a specific store automatically feeds the same dashboard used for ROI reporting.
Standardized reporting templates with mandatory fields, a photo of the setup, a unit count, start and end time, remove the guesswork that causes inconsistent logs between ambassadors and store staff. Without a required format, one ambassador might note "sold well" while another logs exact unit counts; neither is useful for comparing store performance side by side. On the retailer side, a centralized calendar visible to store staff, brand teams, and demo agencies cuts down the phone calls and email chains that otherwise fall on store employees trying to confirm who's showing up and when.
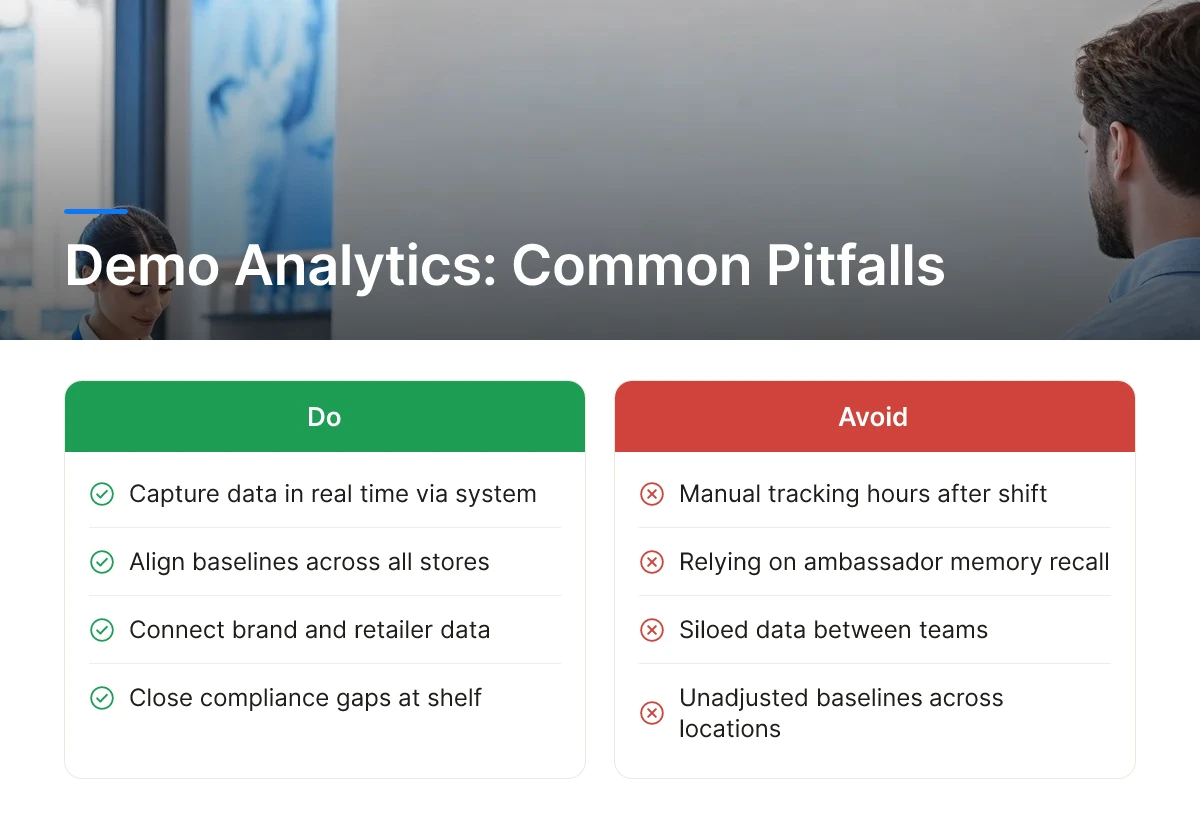
Most bad demo performance analytics trace back to four causes: manual tracking delays, compliance gaps at the shelf, siloed data between brand and retailer, and unadjusted baselines across stores.
Manual tracking fails because it depends on a human remembering details hours after the fact instead of a system capturing them in real time. An ambassador who files a recap the next morning is reconstructing the shift from memory, and recall bias creeps in, foot traffic gets rounded up, slow stretches get forgotten, and sample counts become estimates rather than records.
Photo verification is the piece most spreadsheet-based programs skip entirely. Without a timestamped image of the table setup, a brand has no way to confirm the display went up correctly, the signage was used, or the demo ran the full scheduled window.
Inconsistent time-stamping compounds the problem. If one store logs a demo as running 11 a.m. to 2 p.m. and another logs "midday," any attempt to compare sales lift across those two events is comparing incompatible data. This is why in-store demos still consistently outperform non-sampled products on the shelf [2], the format works, but a brand can't prove it store by store if the underlying logs don't line up.
A demo that starts late, runs understaffed, or gets set up in the wrong aisle no longer represents the activation the brand planned, yet the sales numbers from that flawed session usually still get logged as if it had. Placement matters enough that a table near the entrance or checkout line can outperform one in a back aisle by a wide margin, meaning a single compliance miss can quietly wreck a month of comparative data.
Siloed data makes the problem worse. Retailers hold POS data the brand never sees, while brands hold ambassador logs the retailer never sees, and neither side can calculate true lift without the other. Comparing results across stores also breaks down without normalizing for traffic volume and day of week, a Saturday demo in a high-volume store will always beat a Tuesday demo in a quiet one, regardless of execution quality. Demo Wizard's store-level performance segmentation exists specifically to catch these mismatches before they get treated as real trends.
Scaling demo performance analytics nationally requires replacing spreadsheets with a shared system of record and standardized metrics everyone uses the same way.
A tracking method that works fine for 10 stores usually breaks somewhere between 50 and 100. The problem isn't the volume of data, it's that reconciliation time grows faster than store count. With 10 stores, one coordinator can call each location, cross-check a spreadsheet, and catch errors by hand in an afternoon. At 100 stores across a dozen retail banners, that same reconciliation involves chasing down reports from multiple ambassadors, multiple store managers, and sometimes multiple distributors, each using a slightly different template. The coordinator isn't just entering more rows, they're resolving more conflicts, more missing fields, and more version mismatches, and that overhead compounds nonlinearly as the footprint expands.
The fix is a single system of record for scheduling and reporting that the brand, retailer, distributor, and demo agency all access directly, rather than each party keeping its own parallel tracker. When everyone works from the same schedule and the same reporting fields, there's no translation step between what an ambassador logs in the field and what a brand manager sees on a dashboard. This is the core infrastructure shift behind platforms like Demo Wizard, which centralizes scheduling, ambassador management, and post-demo analytics so a national program produces one consistent data trail instead of a dozen fragmented ones.
Standardized, automated reporting dashboards matter as much as the shared system itself. Instead of waiting for regional teams to manually roll up spreadsheets at the end of each month, a brand manager can pull up conversion and sales-lift data by store and time period the moment a demo wraps. That immediacy is what makes it possible to compare a Texas grocery chain's performance against a Pacific Northwest chain's without a two-week lag for someone to compile the numbers.
Visibility depends on consistent metrics definitions across every partner involved. If one demo agency calculates "lift" as units sold during the demo window versus the prior week, and another calculates it against a trailing four-week average, the two numbers aren't comparable, even though both get reported as "lift" on a slide. National programs need one agreed definition for each metric, applied the same way whether the demo ran in a regional co-op or a national chain.
Once metrics are standardized and reporting is centralized, the administrative math changes. Automated coordination and reporting mean the work of overseeing hundreds of monthly events doesn't require a proportional increase in headcount, a structure Demo Wizard is built around, letting a single coordinator manage a multi-state program without hiring a coordinator per region.

Weekly reviews catch problems fast; monthly reviews reveal the store and time-slot patterns worth acting on.
A trade marketing director running 100+ monthly demos needs both cadences: a quick weekly scan for no-shows or stockouts, and a monthly pass through conversion-by-store data to decide where to add or cut activations for the next budget cycle.
Yes, store-level conversion history is the single best predictor of which locations deserve repeat bookings.
A store that consistently converts samples into cart purchases at a higher rate than its regional average is a candidate for a recurring slot or an upgraded roadshow footprint. Stores that underperform despite good foot traffic usually point to placement, staffing, or timing issues rather than a bad location overall.
Ambassadors generate the raw data, units sold, samples given, shopper feedback, that any analytics dashboard depends on.
If check-in times, sample counts, or sales tallies are logged inconsistently, the resulting ROI numbers are unreliable no matter how good the reporting tool is. Consistent field data entry is the foundation, not an afterthought.
Roadshows track cumulative multi-day sales velocity and bundle uptake, while single-day demos measure a narrower sampling-to-purchase snapshot.
Because a roadshow runs 3 to 10 days with dedicated inventory and exclusive bundle offers, brands need to watch units sold per hour across the full run, restock timing, and whether bundled SKUs outsell standard shelf packs, not just a single conversion rate. A one-day demo, by contrast, is usually judged on sample-to-purchase rate alone.
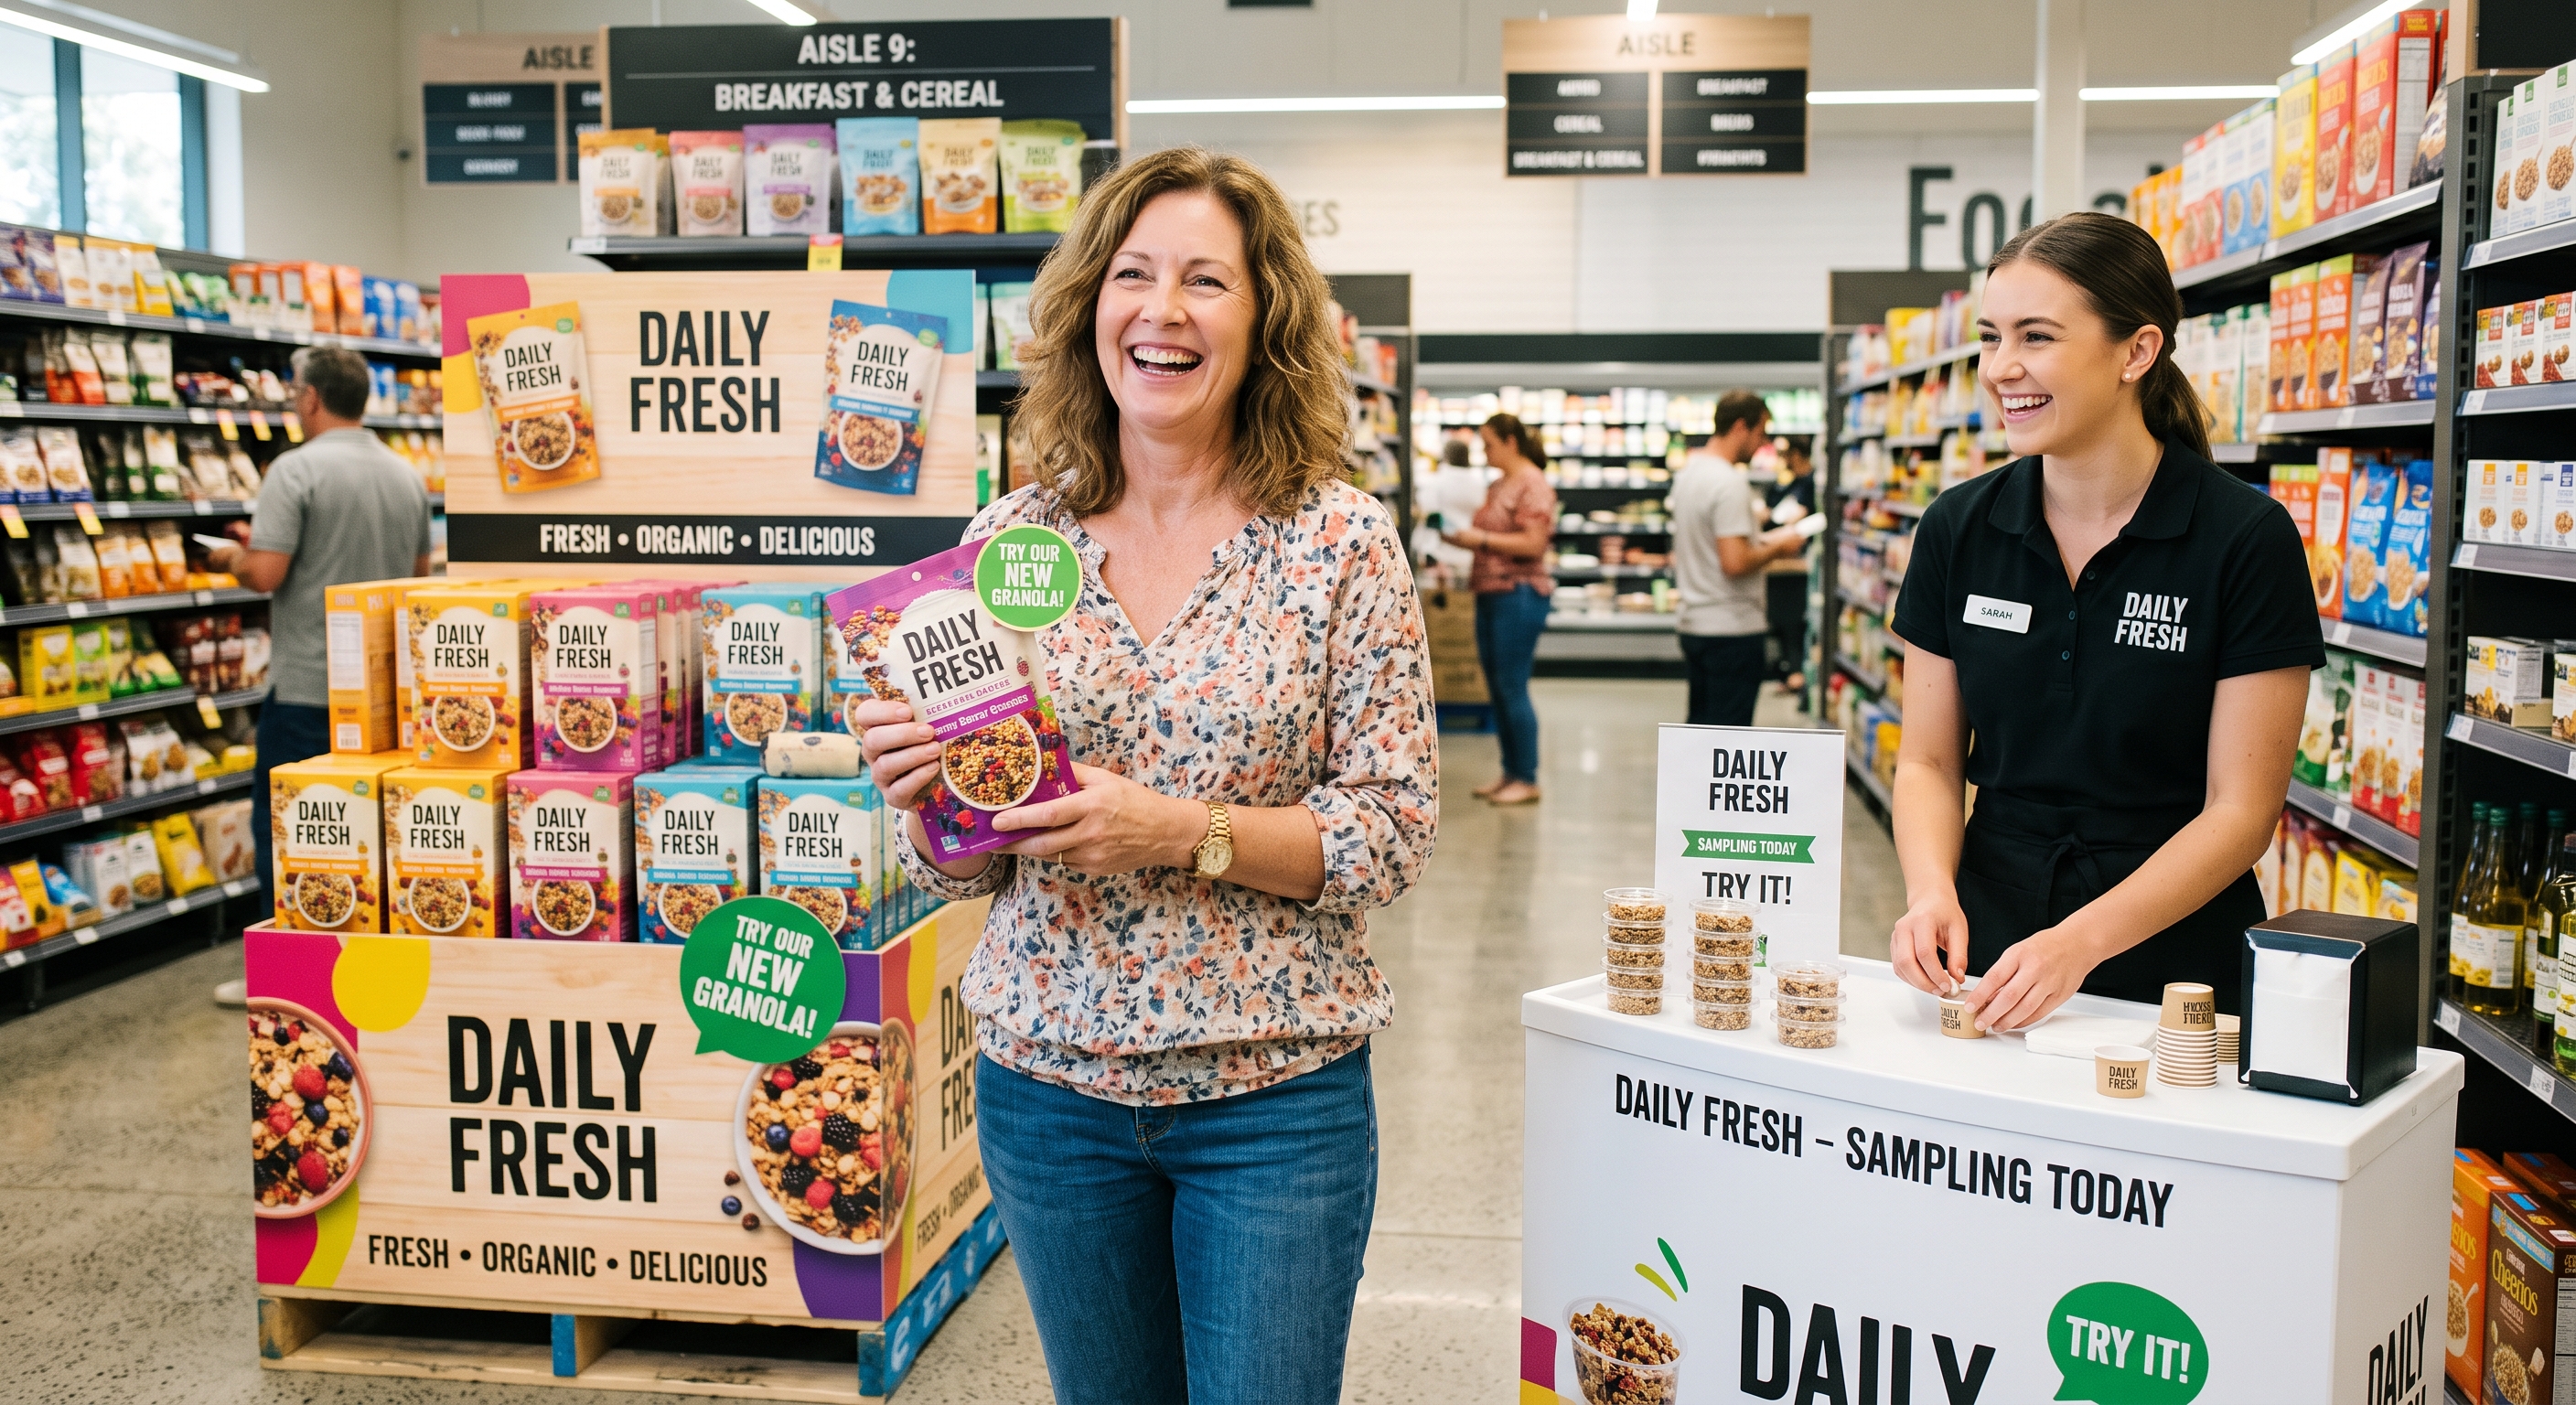
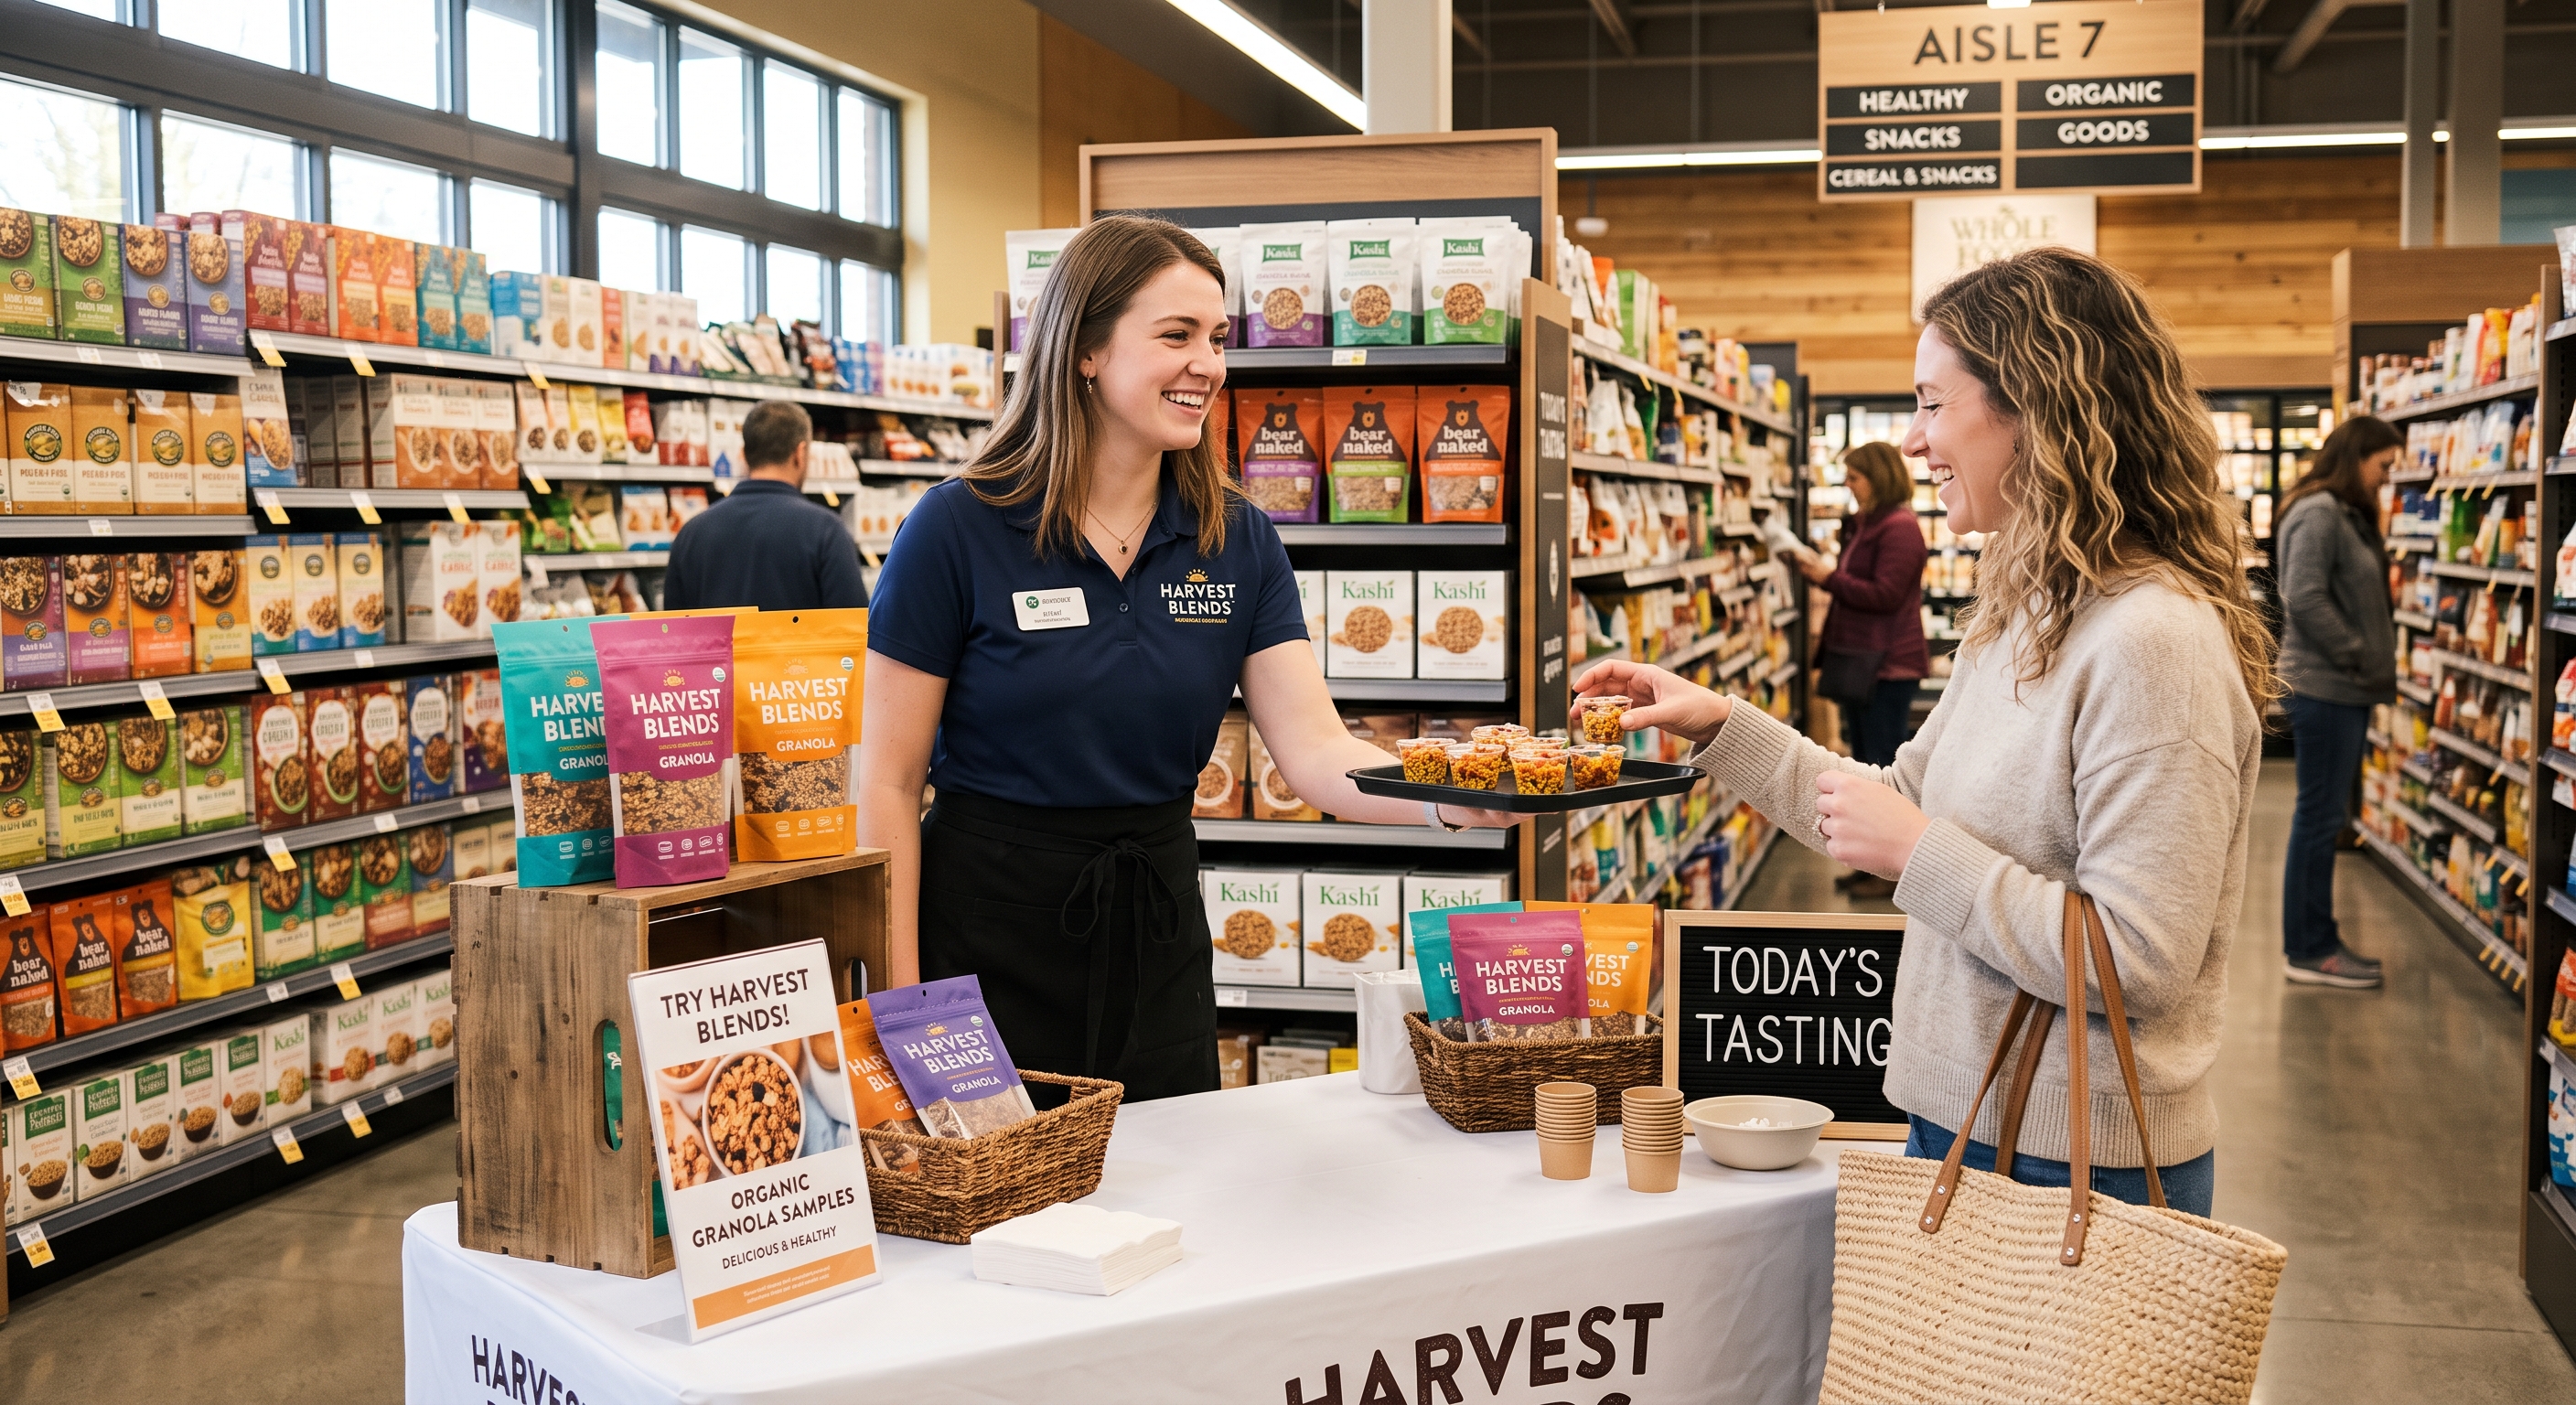

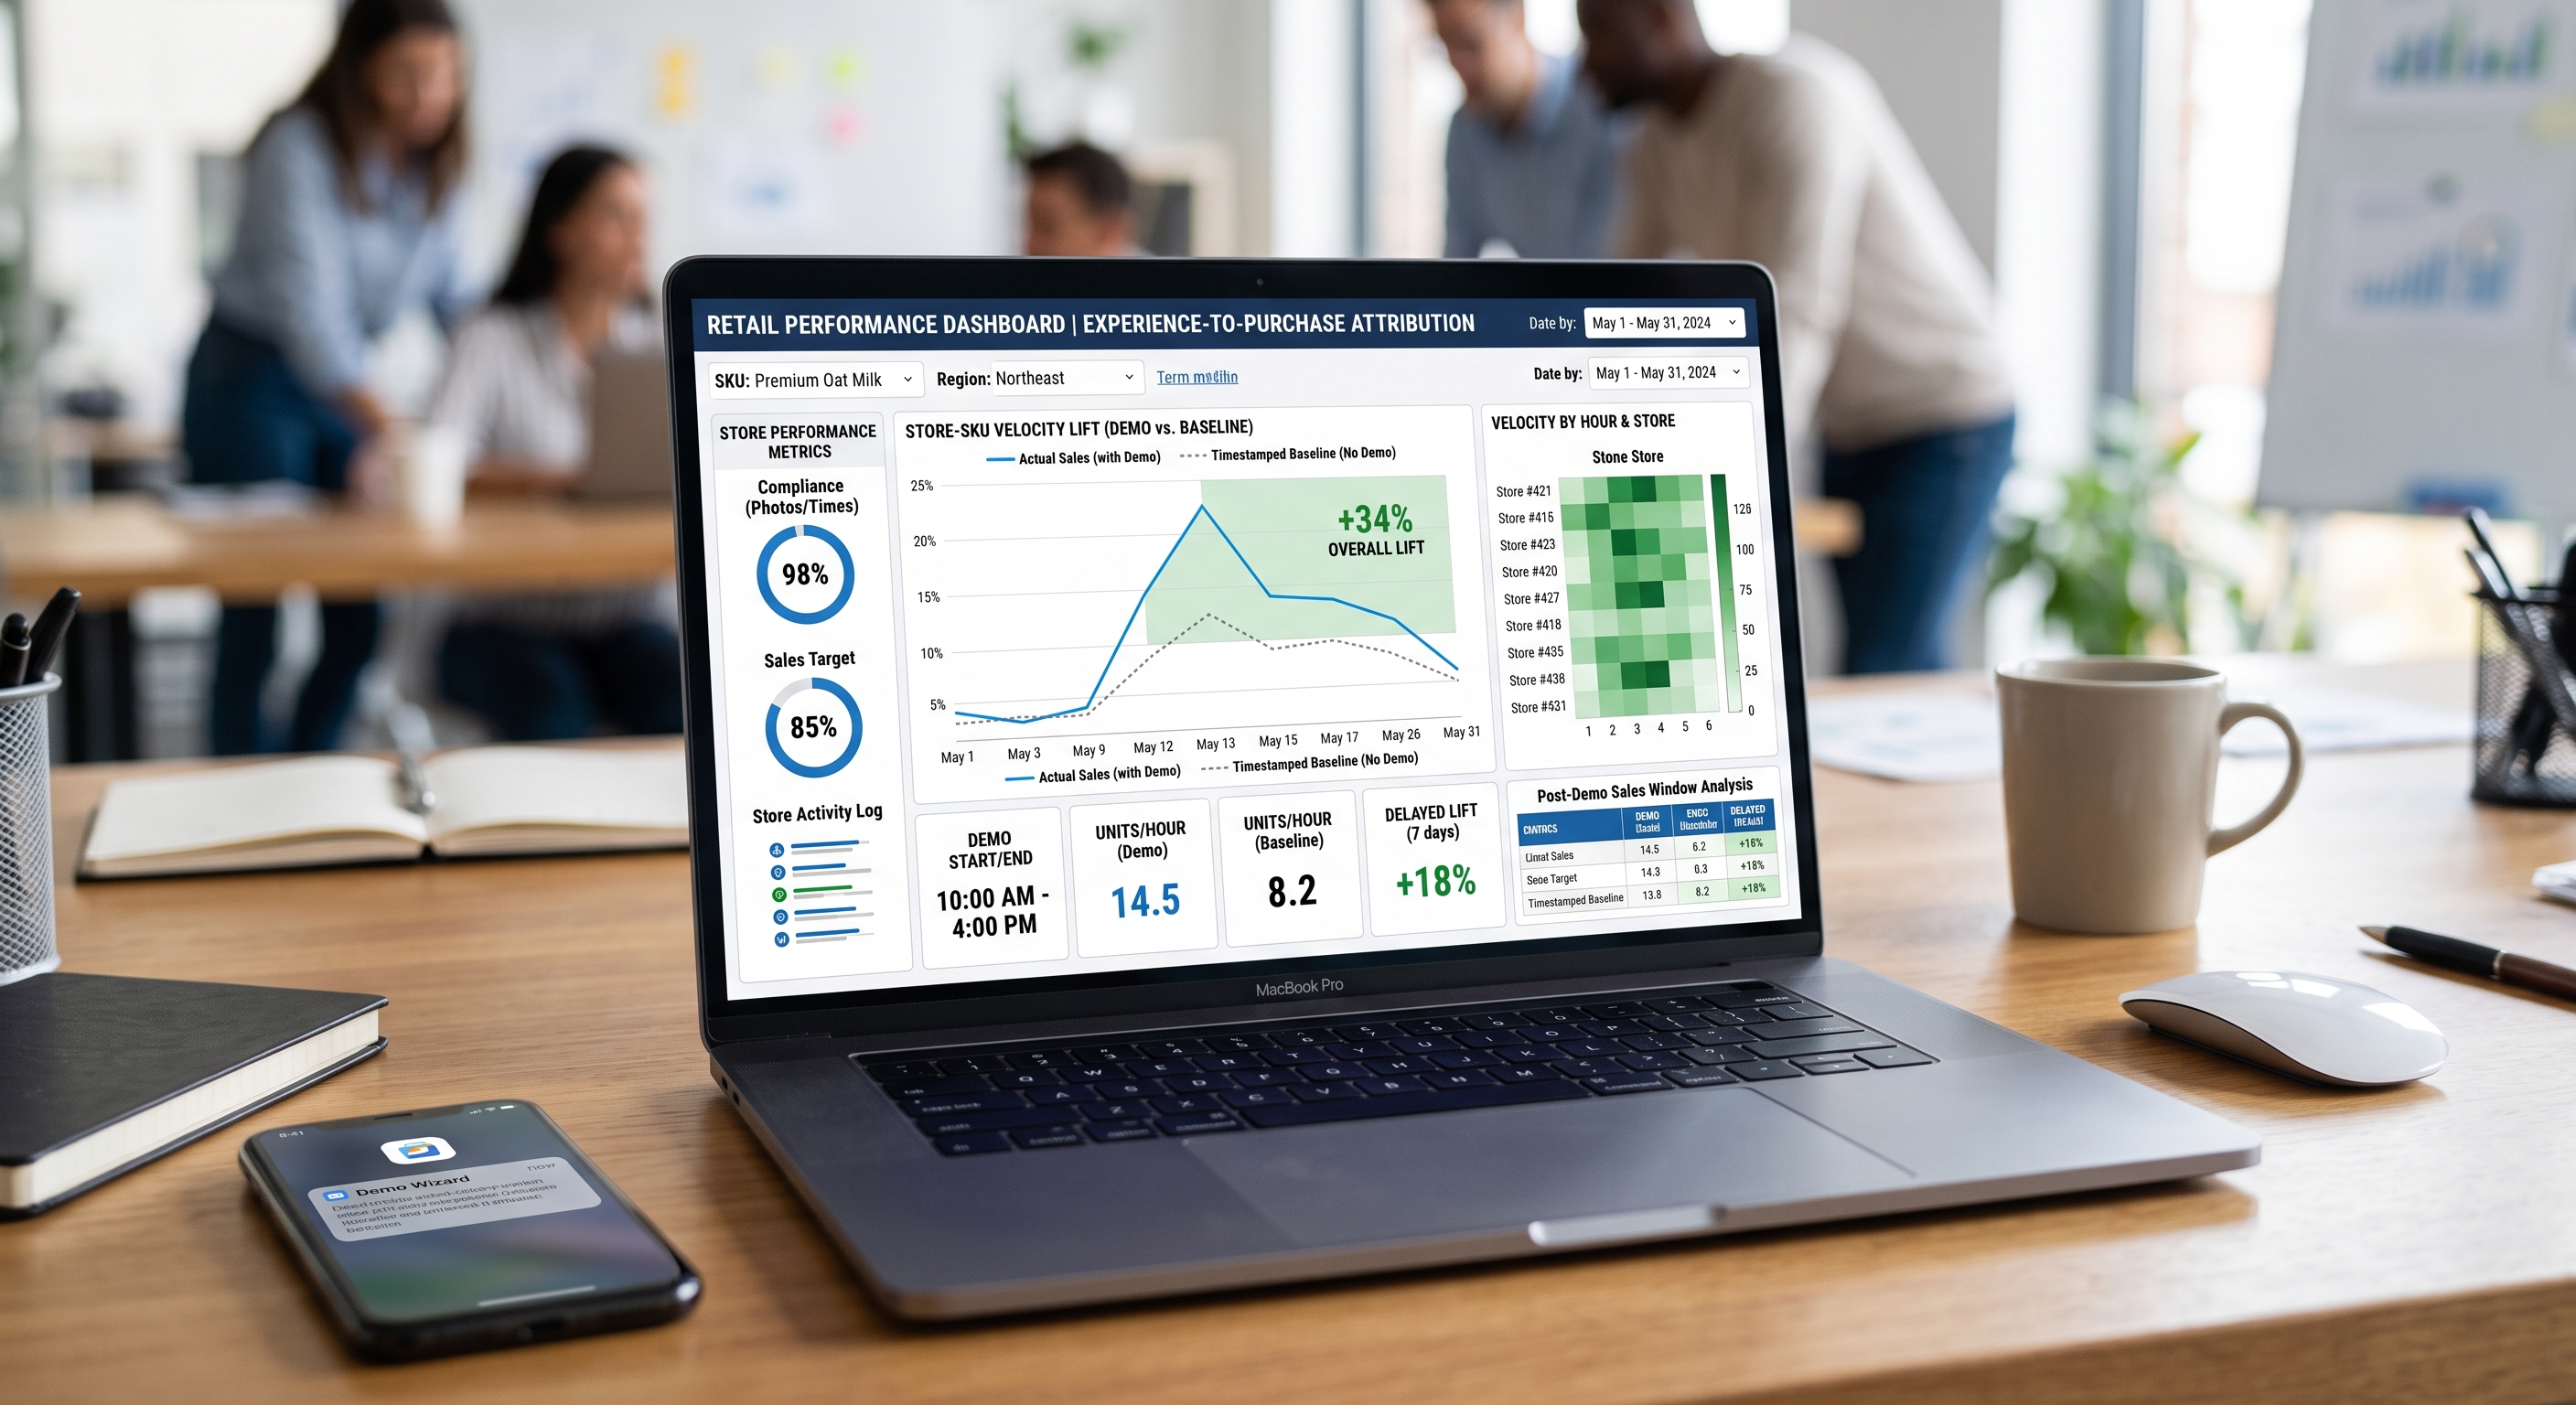
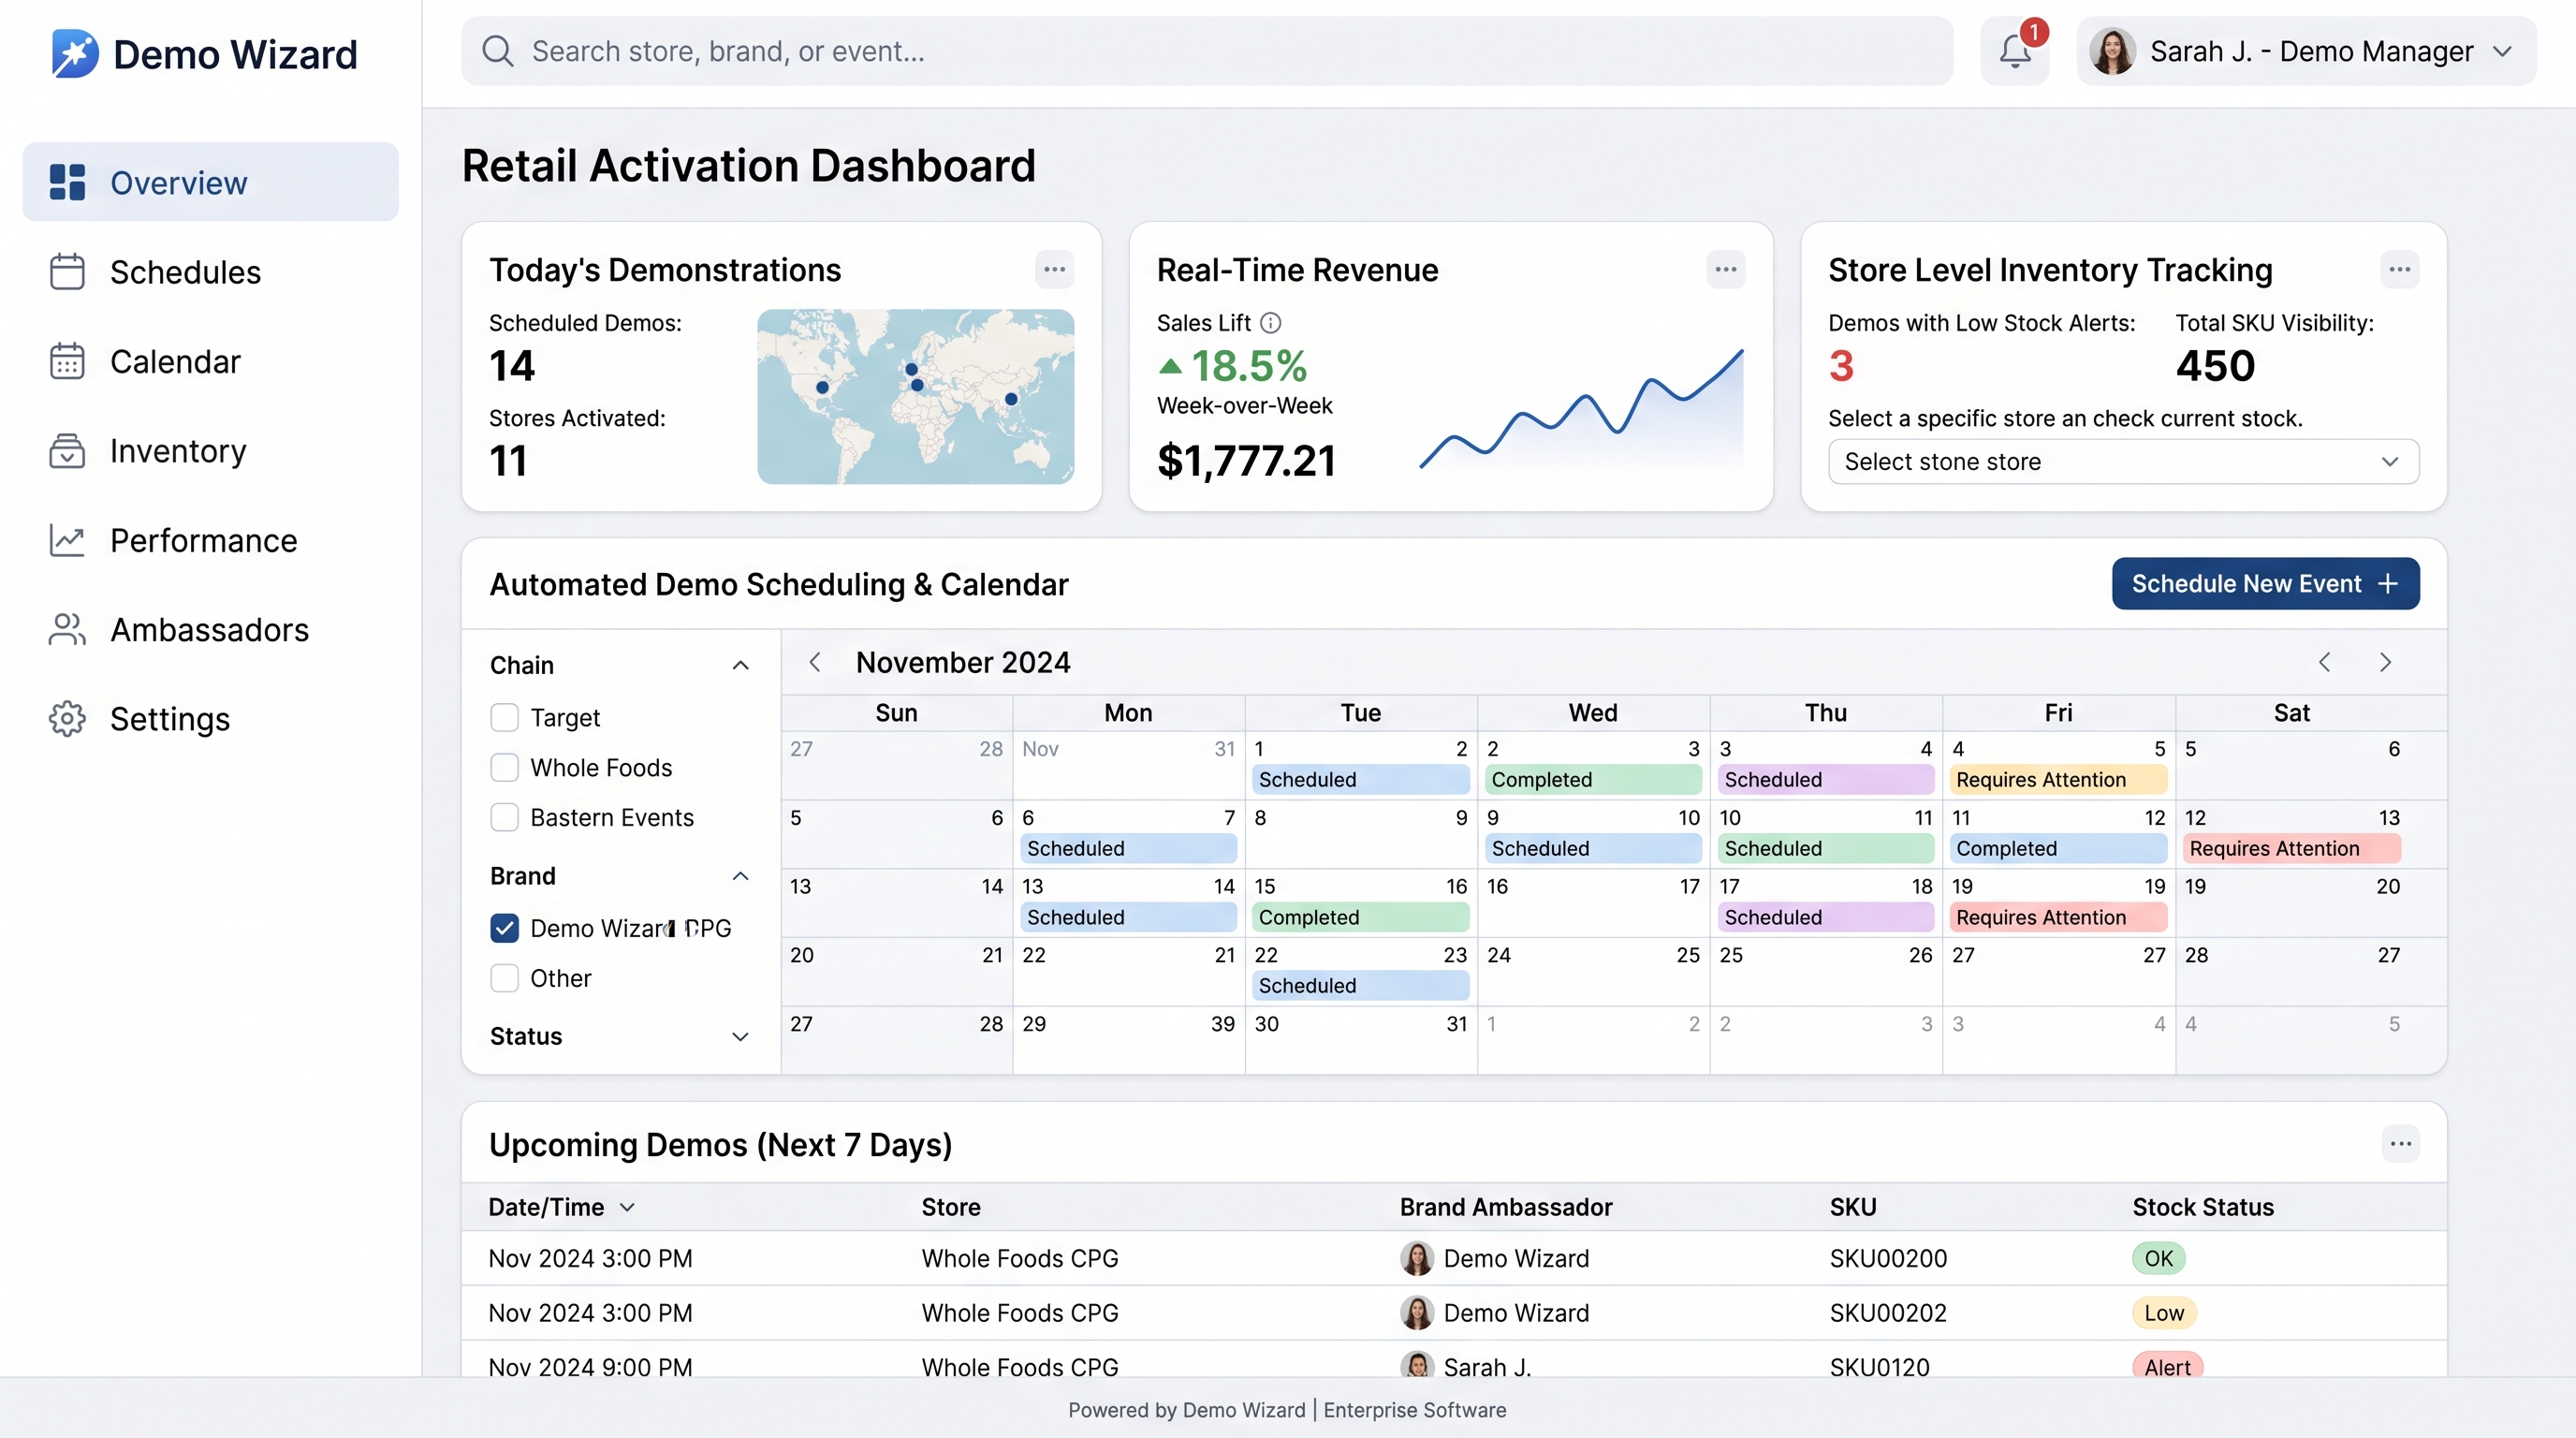
Measuring demo performance comes down to three habits: track conversion by store and time slot, hold ambassadors accountable for consistent field data, and separate roadshow metrics from single-day sampling metrics since they answer different questions. Brands that skip this discipline keep funding activations on gut feel, while retailers keep losing visibility into what's actually happening on their floor.
The next step is practical: pull your last 90 days of demo data, sort by store-level conversion, and identify your bottom 20% of locations. A platform like Demo Wizard can automate that sorting going forward, but the first cut can be done manually this week.
Explore more from our content library:
Demo Wizard is the Ultimate Store Sampling & Demonstration management software for Brick and Mortar Retailers and CPG Vendors.
Chat with usPhone