
Demo Wizard is the Ultimate Store Sampling & Demonstration management software for Brick and Mortar Retailers and CPG Vendors.
Chat with us

Phone
Copyright © 2026 Demo Wizard
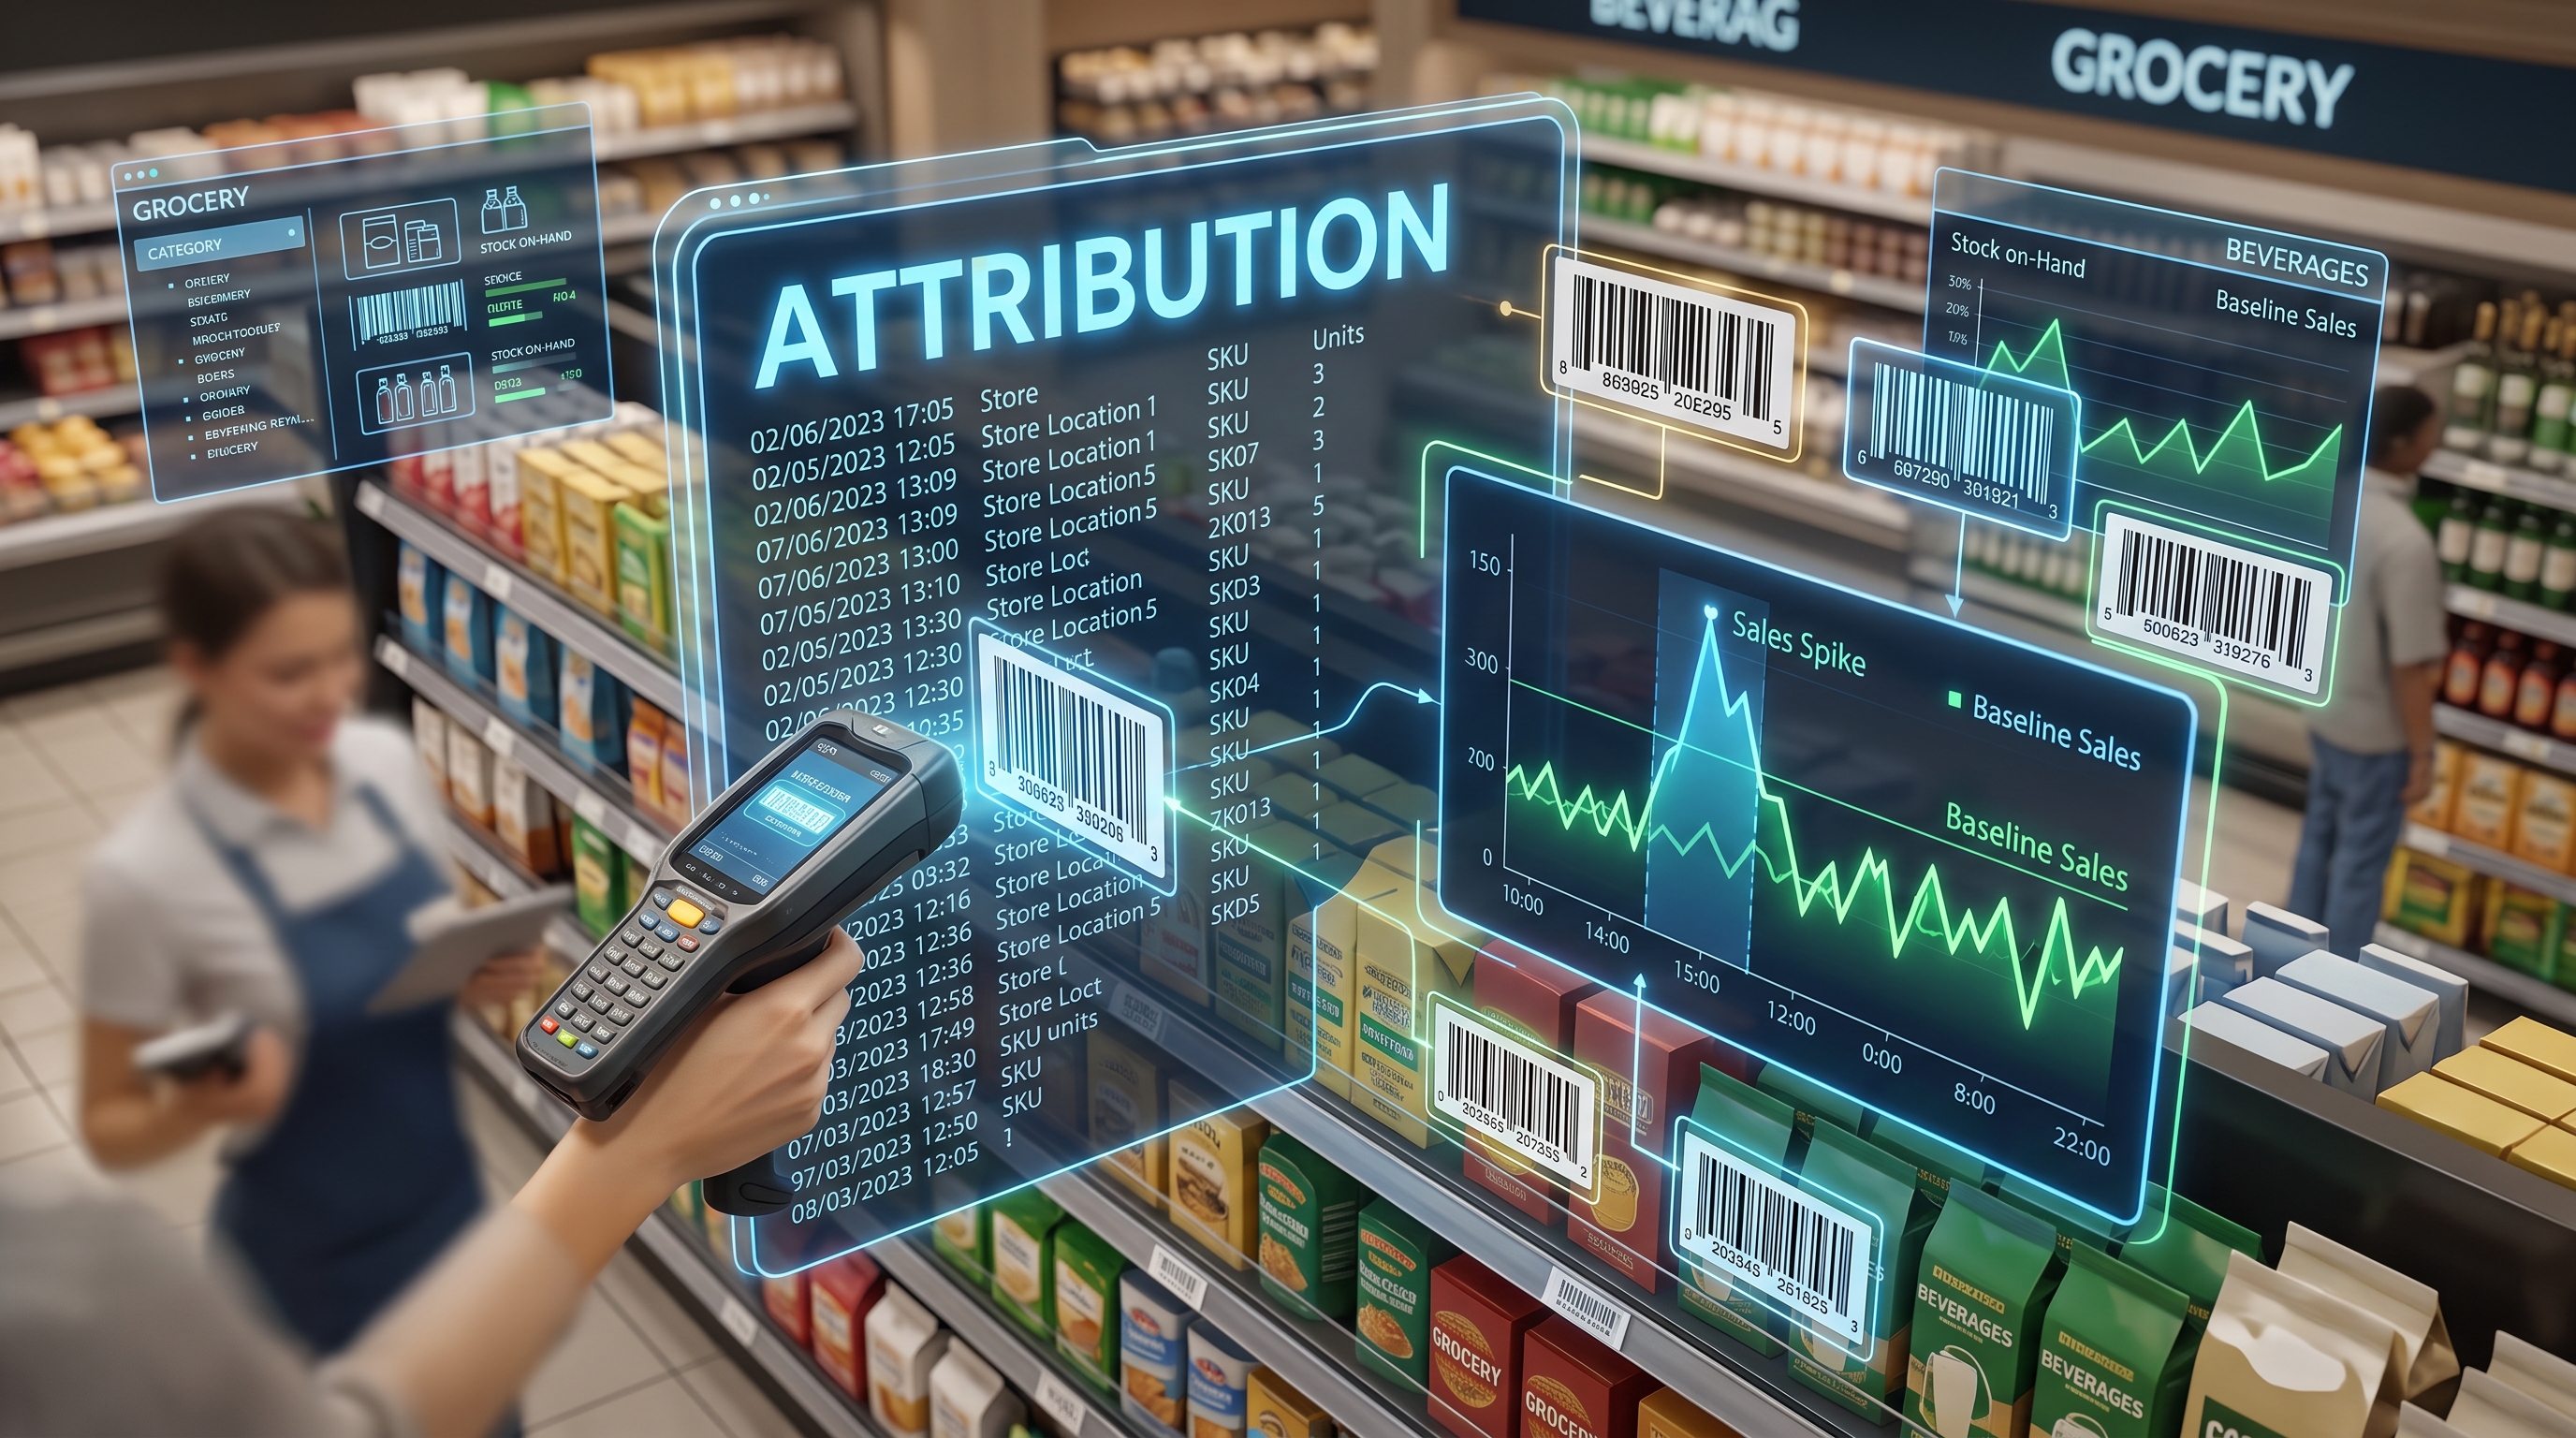
stores andUnderstanding demo attribution retail is essential. CPG brands can measure whether in-store demos drive sales by linking demo schedule and execution data (dates, times, stores, staffing) to point-of-sale movement in those same stores during and after the event, then comparing that lift against non-demo baseline periods or control stores. The strongest proof combines timestamped proof-of-performance (photos, check-ins, units distributed) with store-level POS extracts, so a brand can isolate a sales spike and trace it back to a specific demo rather than seasonality or promotion overlap.
The core mechanism is comparative: a brand matches the exact date, time, and store of a demo to the point-of-sale movement for that same SKU, then measures the difference against a period or store where no demo ran.
That comparison is the entire practice of demo attribution retail teams rely on. There's no single "conversion event" to point to, instead, a brand pulls POS extracts for the demo store during and after the activation window, then lines them up against a baseline: the same store the week before, or a comparable store nearby that had no demo that weekend. If units per hour jump during a Saturday roadshow and settle back down the following week, that gap is the working estimate of the demo's lift. For a broader look at how attribution challenges play out across retail marketing generally, see this overview of marketing attribution in retail.
Digital attribution has clickstreams, cookies, and session IDs that tie a specific ad impression to a specific purchase within a tracked window. In-store demo measurement has none of that. A shopper who samples a product and buys it ten minutes later leaves no digital trail connecting the two events.
What retail activation teams substitute instead are physical-world proxies: timestamped check-ins from the brand ambassador, photos documenting setup and foot traffic, staffed hours logged against the schedule, and units distributed versus units sold. These become the closest equivalent to a click, not a guaranteed link to a transaction, but a reasonable marker that the activation happened, when, and where. Matching those timestamps to hourly or daily POS data is what makes the lift calculation possible at all.
Isolating a demo's true effect is hard because stores rarely run one variable at a time. Several factors commonly confound the picture:
A concurrent price promotion or temporary markdown running the same weekend as the demo
An end-cap or secondary display placed near the demo table
A competitor's own in-store sampling event pulling from the same shopper pool
Weather, such as a cold front keeping shoppers home
Seasonality tied to a holiday weekend or local event
A brand running a roadshow the same weekend a retailer drops the shelf price 15% has no clean way to separate the two effects from POS data alone. This is why in-store attribution stays probabilistic and comparative rather than deterministic. A tracked digital ad click either happened or it didn't; a demo's contribution is always an estimate built from before-and-after comparisons and demo-store-versus-no-demo-store baselines, not a certainty. This inherent complexity is why retail media attribution models increasingly emphasize incrementality testing rather than simple before-and-after snapshots, a principle that applies just as much to demo attribution retail programs as it does to digital retail media.
Measuring demo ROI in retail requires three linked data streams: demo execution records, unit-level POS sales, and store inventory at the time of the demo.
Without all three, demo attribution retail programs end up guessing rather than measuring. Each stream covers a different piece of the picture, and none works alone.
Demo schedule and execution records: date, time window, store number, ambassador name, and product SKU demonstrated. This is the record of what actually happened, not just what was planned.
Unit-level POS sales by store and day: the transaction data that shows whether units moved during and after the demo window, broken out by the same store number used in the schedule.
Inventory or stock-on-hand at time of demo: a demo with an empty shelf produces a sampled shopper and no sale. Stock data explains lift that didn't happen for reasons unrelated to the demo itself.
Store-level foot traffic counts give you a baseline to separate a demo's lift from a normal busy Saturday.
If a store sees double its usual visitor count on a given weekend, because of a holiday, a nearby event, or a competitor's store closing, sales might rise regardless of the demo. Comparing demo-day sales against store-level traffic counts, not just against last week's sales, isolates the demo's actual contribution. This is aggregate, door-count data: a sensor or retailer feed reporting how many people entered the store in an hour, not information tied to any individual. Teams evaluating an analytics platform to help manage this kind of comparison can review how a demo account works before connecting real store data.
The compliance questions here concern retailer data-sharing agreements, not personal privacy law, since none of this data identifies an individual shopper.
Demo schedules, POS sales, inventory levels, and store traffic counts are operational and transactional records at the store and product level. A brand tracking these figures is not collecting names, loyalty numbers, or purchase histories tied to a person, it's asking whether Store #4521 sold more units of a product on the days a demo ran there. The relevant agreements govern what data a retailer will share with a CPG brand or its agency, at what level of granularity, and on what schedule. Brands should confirm these terms before a campaign starts, not after a retail partner questions why sales figures showed up in a report.
Mismatched timeframes and missing store IDs break attribution before analysis even begins. If POS data is logged by calendar week while demo records use exact dates, or if one system uses a retailer's internal store number and another uses a street address, the two data sets never line up cleanly. Getting store ID formats and timestamp conventions aligned across systems matters more than any analytics dashboard built on top of them, and it's one of the most common reasons a demo attribution retail initiative stalls before it produces usable numbers.
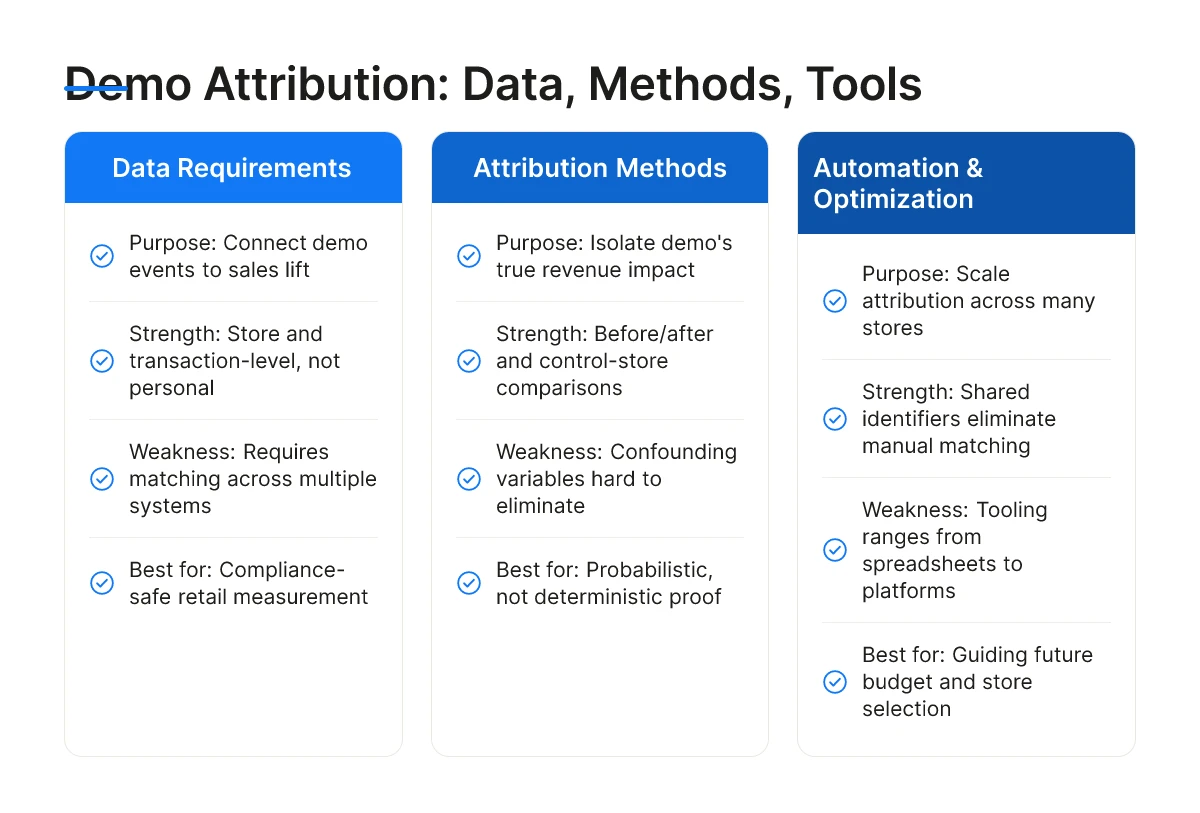
Brands connect demo activity to revenue by comparing store-level sales data across three windows, before, during, and after the event, and by checking that lift against stores that ran no demo at all. Neither method requires a data science team; both require clean records of when and where each demo happened.
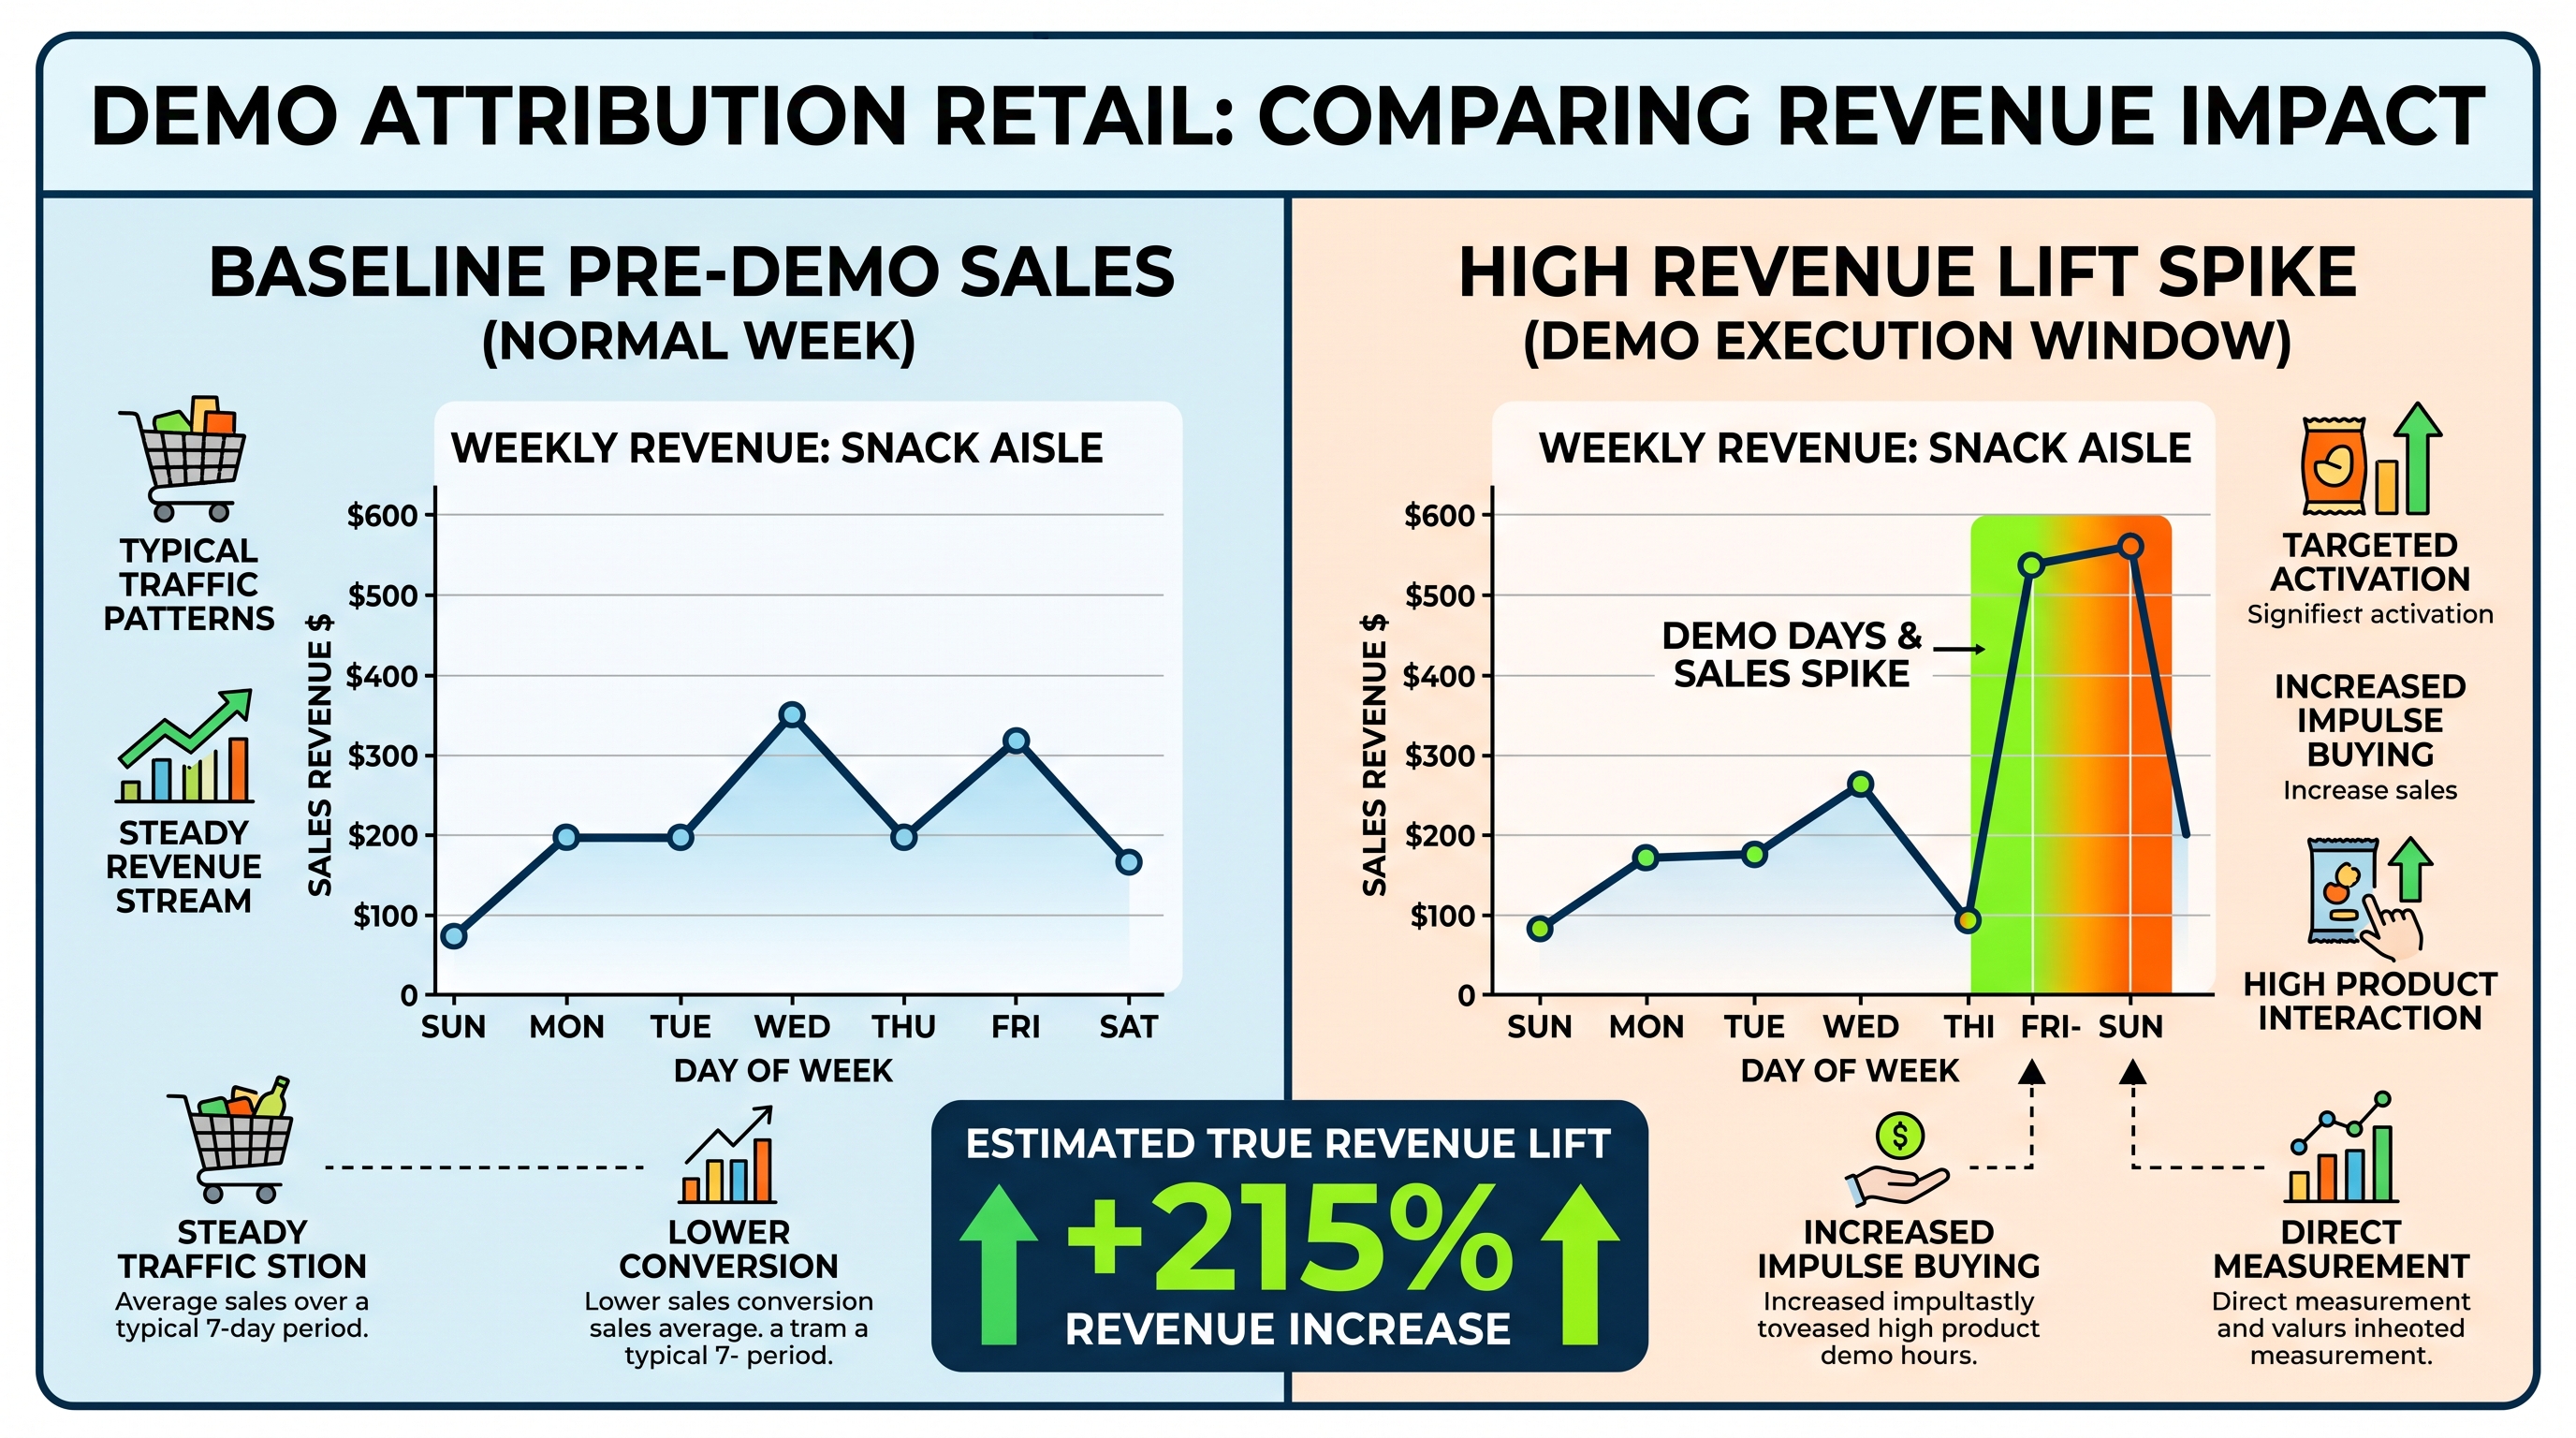
The simplest method looks at one store across three time slices: baseline sales in the two to four weeks before the demo, sales during the demo window itself, and sales in the weeks after. A spike during the demo window, followed by a partial return to baseline (or better, a new higher baseline), suggests the demo moved product rather than just pulled forward purchases shoppers would have made anyway.
This method is the backbone of most demo attribution retail practices because it doesn't require access to other stores' data, a single store's point-of-sale history is enough. Its weakness is that it can't rule out other causes of the spike, like a competitor stockout or a seasonal bump.
Control stores fix that blind spot by comparing a demo store's sales to a similar, non-demo store in the same chain and region over the identical period. If both stores saw a 5% lift that week, the demo probably contributed little, the lift was market-wide. If the demo store outperformed its control by a wide margin, that gap is a cleaner estimate of what the demo actually drove.
Choosing a good control matters more than the math that follows. Retailers and brands typically match stores on weekly volume, regional demographics, and shelf placement before treating the comparison as valid.
These terms come from digital marketing, but they translate directly to the physical store floor. Last-touch crediting gives the demo full credit for any purchase that happened during or right after the event, clean, but it ignores everything else happening in the store. First-touch works similarly when the demo is the shopper's first exposure to a product before later buying it online or on a return visit.
Multi-touch attribution matters most when a demo runs alongside a concurrent in-store promotion, like an end-cap discount or a coupon drop. In that case, splitting credit between the demo and the promotion, rather than awarding all of it to one, gives a more honest picture of what drove the lift, even if the split is an estimate rather than an exact number. This is one of the areas where demo attribution retail practice borrows most directly from established multi-touch models used in digital marketing.
In practice, a revenue-lift readout is a simple table: units sold per day during the demo window, set against the average daily units sold in the pre-demo baseline period, for that same store. A brand running a weekend roadshow might see baseline sales of 20 units a day jump to 80 units a day during the event, an easy calculation once the baseline and demo-window numbers are pulled from the same point-of-sale system. Platforms like Demo Wizard generate this comparison automatically by pairing scheduled demo dates and store locations with performance data, so a coordinator running hundreds of monthly events doesn't have to build the comparison by hand for every store.
Automated systems join scheduling records to sales data using shared identifiers, replace paper check-in logs with timestamped digital proof, and give every stakeholder one calendar to work from.
That combination is what separates demo attribution retail programs that scale past a handful of stores from ones that stall at 20 or 30 locations because a single coordinator can't manually reconcile spreadsheets fast enough.
Demo scheduling data and point-of-sale exports have to share common fields, store number, SKU, and date, so the two data sets can join automatically instead of requiring someone to match rows by hand in Excel. Without a shared identifier scheme, a brand manager ends up eyeballing which Tuesday demo at store #4471 corresponds to which line in a retailer's weekly sales file, a process that breaks down fast once a campaign runs in more than a dozen doors.
Retailers and distributors format sales exports differently, so the scheduling platform typically needs to normalize store numbering and product codes before any comparison is possible. This is infrastructure work, not analytics work, but skipping it means every reporting cycle starts from a data-cleaning exercise rather than a finished dashboard.
Automated check-in and check-out, backed by timestamps and photo proof-of-performance, gives attribution a reliable start-and-end reference for each event, replacing the paper sign-in sheets that ambassadors used to fax or email back to headquarters. That timestamp becomes the anchor point analysts use to pull the correct sales window from POS data, rather than guessing at what time a demo actually started.
A centralized calendar visible to the brand, the retailer, and the demo staff prevents double-booked tables and gives all three parties the same execution record to check against sales results later. This also lifts a real burden off retail store teams: instead of store employees fielding phone calls from vendors, brokers, and ambassadors to confirm who's showing up and when, the schedule is already visible and confirmed before anyone walks in the door.
Tooling here falls into clear tiers. Spreadsheet-based tracking is budget-friendly but manual and prone to transcription errors as volume grows. Purpose-built coordination platforms sit in the mid-range to premium tier and automate the matching, reporting, and ambassador payroll that spreadsheets can't handle at scale. Demo Wizard, for instance, bundles scheduling, ambassador management, and store-level performance reporting into one system, so a single coordinator can run hundreds of monthly events without hiring a data-entry team to reconcile the results.
Brands turn measured demo results into a repeatable planning input, using revenue lift by store, day-part, and ambassador to decide where and how often to schedule the next round of activations.
The single most useful comparison is store against store. A brand running the same product demo in 40 locations over a quarter will see a spread, some stores post a strong sales bump every time, others barely move. That pattern, tracked over repeated events rather than one weekend, tells a brand activation manager which store formats, traffic patterns, or day-parts are worth repeating and which aren't. A Saturday afternoon demo near the entrance of a high-traffic supermarket might consistently outperform a Tuesday morning slot in a smaller-format store, data worth acting on rather than ignoring. This kind of pattern recognition is exactly what a mature demo attribution retail program is meant to produce over time.
Three signals tend to drive the decision: revenue lift per event, conversion rate relative to foot traffic, and consistency across repeated visits to the same location.
When a store or region shows flat or declining lift across two or three consecutive demos, that's a signal to change something rather than repeat the same play. Options include swapping which SKU gets featured, adjusting staffing (a more experienced ambassador instead of a first-timer), or cutting the location from the schedule entirely. Underperforming categories, say, a new flavor line that isn't converting despite good foot traffic, often need a different demo script or bundled offer, not just more frequency.
Budget follows lift: brands shift spend toward stores and regions with proven repeat performance and pull back from locations that consistently underperform, using several cycles of data rather than a single event to make the call.
This is where demo attribution retail data earns its keep as a planning tool rather than a scorecard. A coordinator managing a multi-state program can reallocate a fixed monthly demo budget, more events in the top-quartile stores, fewer in the bottom quartile, without waiting on a full quarterly review. Platforms like Demo Wizard support this by segmenting performance insights by store and time period, so a brand can see which locations justify more frequent activations before committing the next month's spend.
Consistent proof-of-performance also changes the conversation with retail partners. A brand that can show a retailer three consecutive quarters of measurable lift from its in-store demos has a stronger case for expanded floor space, better time slots, or a renewed program, the data replaces the pitch.
Yes, though the results are directional rather than exact. Manual sales pulls from store managers, syndicated scan data, or before-and-after unit counts can approximate lift when a live POS feed isn't available. A direct integration produces cleaner, faster results, but brands running a handful of demos monthly can still learn a lot from manual comparisons if they're consistent about timing and store selection.
Most brands check sales lift within 3 to 7 days post-demo, then again at 2 to 4 weeks to catch repeat purchases. The shorter window captures the immediate sampling effect; the longer one shows whether trial converted into a habit. Comparing against the same store's baseline sales from a prior, demo-free period improves accuracy.
Not fully, but they aren't locked out either. Large chains often have loyalty data and integrated POS systems that make attribution more precise, while independents may rely on manual register counts or shelf checks. A single-store operator can still track lift by comparing sales the week of a demo against a typical week, which is a rough but usable method.
Store staff confirm that a demo happened as scheduled, which is the foundation attribution data depends on. They can flag setup problems, stockouts, or schedule changes that would otherwise skew sales numbers. Without that confirmation, a brand risks crediting or blaming a demo for sales results driven by something else entirely.
The most common mistake is treating attribution as an afterthought instead of building it into the demo process from the start. Brands that wait until after a campaign to ask for sales data often find mismatched store IDs, missing timestamps, or incomplete execution records. Building consistent proof-of-performance capture into every event from day one is what makes reliable measurement possible later.
Proving that an in-store demo drove sales takes more than a gut feeling about a good Saturday. It requires a consistent record of when and where each demo happened, a sales baseline to compare against, and a system that connects the two without relying on a coordinator's memory or a stack of spreadsheets.
Start by auditing your last quarter of demos: how many have a verified date, store, and sales comparison on file? If the answer is fewer than half, that's the gap to close first. Platforms like Demo Wizard exist specifically to make that record automatic rather than optional.
Explore more from our content library:
About the Author
Written by the SaaS / Retail Marketing Technology experts at Demo Wizard. Our team brings years of hands-on experience helping businesses with SaaS / Retail Marketing Technology, delivering practical guidance grounded in real-world results.
Demo Wizard is the Ultimate Store Sampling & Demonstration management software for Brick and Mortar Retailers and CPG Vendors.
Chat with usPhone