
Demo Wizard is the Ultimate Store Sampling & Demonstration management software for Brick and Mortar Retailers and CPG Vendors.
Chat with us

Phone
Copyright © 2026 Demo Wizard

A manual demo tracking spreadsheet breaks down beyond roughly 20 in-store events a month because static files cannot handle real-time, multi-user updates across field staff, store managers, and vendors. Scaling past this volume creates significant coordination overhead, scheduling errors, delayed compliance visibility, and lost sales lift, requiring CPG brands to transition to dedicated coordination platforms.
A demo tracking spreadsheet breaks down once a brand runs more than roughly twenty in-store demos a month, because manual updates can't keep pace with simultaneous scheduling, staff confirmations, and compliance data across many stores. Past that volume, coordinators spend more time reconciling tabs and chasing updates than managing the demos themselves, and errors like double-booked staff or missed stores start directly costing sales. The fix is tracking the same data—schedules, attendance, compliance, and results—in a system built for real-time, multi-user updates instead of a static file.
A demo tracking spreadsheet breaks down because coordination overhead grows exponentially with every person who needs to read or edit it, while the time to log one demo stays roughly flat. Logging demo five takes about as long as logging demo one. But once three ambassadors, two store managers, and a regional lead all need the same file open at once, the math stops working.
Spreadsheets were built for one editor at a time. CPG brands running in-store sampling across multiple retail chains need many editors at the same time, each updating a different row for a different store on a different day. That mismatch is the root problem, not a failure of discipline or formatting, and it's the same mismatch that eventually pushes most growing brands off a demo tracking spreadsheet entirely.
The cost shows up first as lost hours: coordinators comparing tab versions, texting ambassadors to confirm which schedule is current, and rebuilding rows after someone overwrote a formula. CPG operations teams describe this pattern often, a patchwork of spreadsheets and disconnected tools that works at low volume but becomes the actual constraint on growth once the business scales past it [2].
The second cost is accuracy. A stale cell means an ambassador shows up at the wrong store, or a store manager never finds out a demo was scheduled at all. Reconciling data from multiple retailer portals and systems built for different purposes takes real analyst time before any useful reporting can happen [1], and a demo tracking spreadsheet built by hand multiplies that reconciliation work with every added location.
The third cost is opportunity. By the time a coordinator notices a no-show or an out-of-stock shelf buried in a spreadsheet tab, the sampling weekend is over and the sales lift is gone.
At 5 locations, one coordinator can hold the whole schedule in their head and use the spreadsheet as a backup. At 50, that same coordinator is managing a communication chain running through ambassadors, store staff, and sometimes a broker, and a single missed update can cascade into a double-booked ambassador or an empty table. At 500, no single file can hold current, conflict-free data, no matter how carefully it was built or how many tabs get added.
That is the tipping point mechanism: once update frequency and simultaneous editors exceed what one file can absorb without conflicts, the spreadsheet model fails regardless of design quality.
Every in-store demo program generates four data categories that must stay accurate regardless of whether they live in a demo tracking spreadsheet or a dedicated platform: schedule and calendar data, staff assignment and confirmation status, in-store compliance records, and post-demo results.
Each category answers a different operational question. Schedule data tells you what's happening where and when. Staff assignment data confirms who's covering each slot and whether they've confirmed. Compliance data, setup photos, arrival timing, signage placement, proves the event happened as planned. Results data closes the loop by linking the activation to sales impact. Miss one category and the others lose context: a perfect sales spike means little if you can't confirm which ambassador ran the table or whether the display matched the brand's planogram.
Units sold during the activation window, sales velocity compared to non-demo days, and basket size or average transaction value (ATV) changes are the metrics that tie a demo directly to revenue.
These are not ecommerce metrics. Brick-and-mortar demo performance doesn't have a "conversion rate" in the checkout-funnel sense, there's no cart abandonment to measure. What matters instead is whether a product's velocity (units moved per store per week) climbs during the demo window versus the surrounding baseline, and whether shoppers who sampled the product added complementary items to their basket, lifting ATV. CPG brands juggling POS feeds, syndicated panels, and trade promotion systems already know how hard it is to reconcile data built for different purposes [1]. A demo program adds another layer: without a consistent way to log velocity and basket metrics by store and time, teams end up re-deriving the same comparison every month instead of building on it, something a well-structured demo tracking spreadsheet can only partly solve before volume makes it unworkable.
Track attendance, setup compliance, and performance using your own standardized fields, not each retailer's inconsistent native reporting formats.
A regional grocer, a club store, and an independent natural foods market rarely report demo activity the same way, if they report it at all. Brands running dozens of weekly activations need one consistent record of who showed up, what time they arrived, whether the display matched the plan, and how the product performed, independent of what any single retailer tracks internally. Operations that rely on a patchwork of spreadsheets and disconnected point solutions tend to hit a wall as SKU count, channel count, and retailer relationships multiply [2].
This data typically comes from retailer portals, brokers, or third-party reporting services, not a live feed from the point of sale. A coordination platform's job is to ingest and organize that incoming data cleanly, tying it to the right store, date, and ambassador, not to replace or integrate directly with POS systems. Demo Wizard, for instance, is built to pull in this reporting and structure it by store and time period so brands can see performance patterns without re-entering every retailer's demo tracking spreadsheet by hand. For brands weighing how deep their retail data needs to go, it's worth reviewing what data CPG brands typically need beyond point-of-sale numbers to understand retail performance fully [4].
Spreadsheets fail at multi-actor coordination because no single edit reaches everyone at once, the moment a change happens, the sheet and reality split apart.
A demo tracking spreadsheet has exactly one live version at any moment, but three different groups need to act on it: the store employee who has to clear floor space, the brand ambassador showing up to work the table, and the CPG vendor confirming the activation is happening as planned. When a coordinator updates a cell, nothing pushes that change to the people who need to see it. Someone has to notice the sheet changed, which usually happens after they have already acted on the old version.
This lag compounds with volume. Managing dozens of monthly activations across a handful of stores is survivable with a shared file and some discipline. Scaling toward hundreds of monthly events across multiple states, which is the stated goal for many CPG brand activation managers, turns that same lag into a constant source of friction because far more people are checking a file that is, by design, always slightly behind.
Conflicts show up in predictable ways: an ambassador gets booked for two stores at the same time slot, two brands get assigned the same end-cap on the same Saturday, or a store manager has no idea a vendor is arriving until the ambassador walks in. None of these are data-entry mistakes exactly, they are the predictable result of multiple people editing a static file without a locking mechanism or a single source of truth.
The deeper problem is that confirmations rarely happen inside the spreadsheet at all. A reschedule gets agreed over a text thread, a cancellation gets mentioned on a call, and the sheet itself never gets touched until someone remembers, if they remember. CPG operations research describes this same pattern at the broader level: a patchwork of spreadsheets and disconnected tools becomes the constraint on growth itself once a business scales past its earlier, simpler stage [2]. Without a shared calendar, the store employee becomes the fallback contact for every vendor question, who is coming, when, with what, pulling retail staff away from the job they were actually hired to do.
Demo ROI in brick-and-mortar stores is measured through sales velocity lift and average transaction value, not ecommerce conversion rate, since there's no checkout funnel to track click-through on.
"Conversion rate" belongs to ecommerce, where every visitor and purchase is logged automatically. In a physical store, the comparable question is whether units per store per week rise during a demo window compared to a baseline period, and whether basket size (ATV) grows because shoppers who sampled a product added complementary items to their cart. A brand running a weekend roadshow for a snack line wants to know if sales velocity during those three days outpaced the same store's average over the prior four non-demo weekends, not how many people "clicked" anything.
Attendance and engagement numbers only mean something when they're matched, event by event, against the sales data from the same store and time window. Shoppers sampled and units distributed are leading indicators; sales velocity lift is the outcome they're supposed to predict. If a brand ambassador logs 400 samples handed out on a Saturday afternoon, the next step is pulling that store's unit sales for the same hours and comparing them to a non-demo Saturday baseline.
This matching exercise is where most manual tracking breaks down. CPG operations research shows that once companies scale past a handful of SKUs or retail doors, disconnected spreadsheets and portals create exactly this kind of reconciliation burden, forcing analysts to spend significant time aligning data before any real analysis happens [1]. A demo tracking spreadsheet can hold the attendance numbers fine; the problem is lining those numbers up against sales data that usually lives in a separate retailer portal or distributor report, on a different calendar, with different store identifiers.
A defensible demo KPI set includes:
Isolating demo-driven lift from normal week-to-week sales swings requires the same four data points collected the same way for every single event. Miss staff show-up data on a third of events, or skip photo documentation when an ambassador is rushed, and the resulting trend line is too full of holes to support a renewal pitch to a retail buyer or a brand's own finance team.
Platforms like Demo Wizard address this by capturing attendance, cost, and compliance data automatically as events are scheduled and completed, producing performance data by store and time rather than relying on an ambassador's end-of-shift notes.
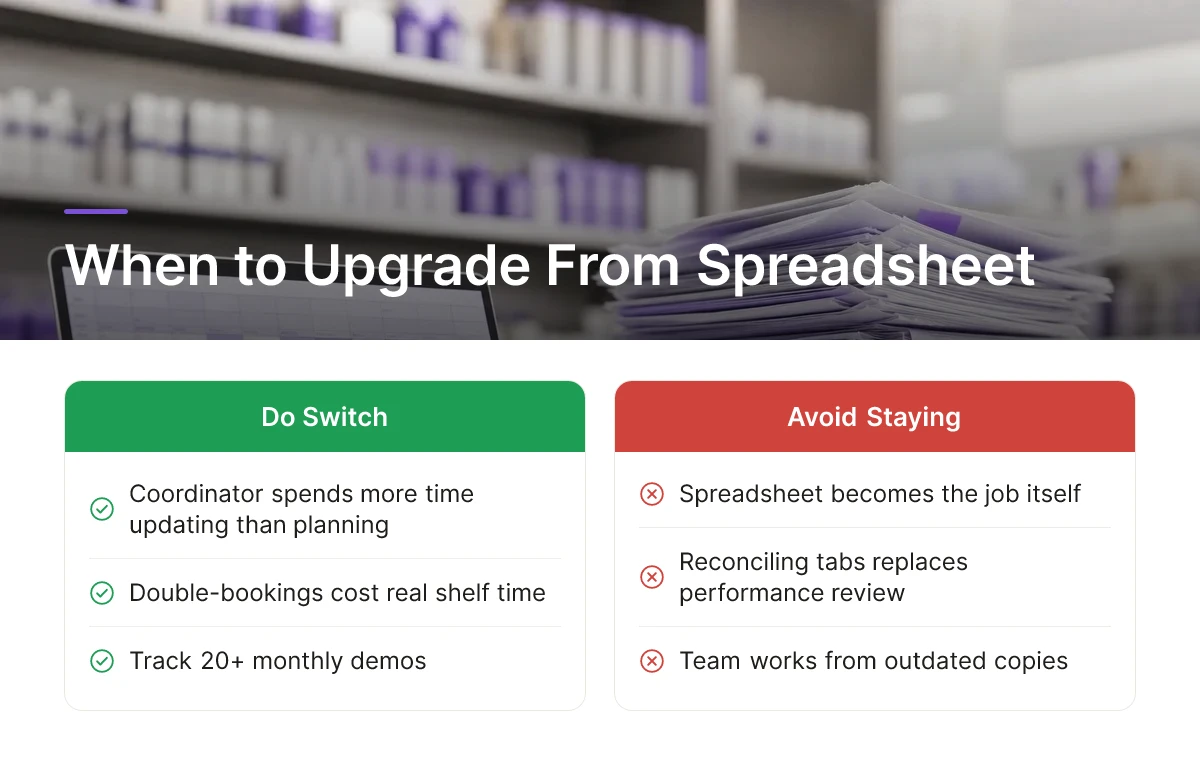
Switch when the coordinator spends more hours updating the sheet than planning the next campaign, or when double-bookings start costing real shelf time. Those are the two clearest signals that a demo tracking spreadsheet has stopped serving the operation and started slowing it down.
A few concrete triggers point to the same conclusion. If a coordinator tracks more than 20 to 30 monthly demos and spends more time reconciling tabs than reviewing store performance, the sheet has become the job rather than a tool for the job. Recurring no-shows or double-bookings traced back to someone working from an outdated copy of the file is another sign, stale data in a shared spreadsheet is a structural problem, not a one-off mistake. A third trigger: store employees fielding repeated questions from vendors and brokers about who's showing up and when, because no one gave them a reliable way to check it themselves.
A spreadsheet is a static file that's accurate the moment someone saves it and stale the moment anything changes. A dedicated coordination platform runs on a shared, live calendar that updates for every store, ambassador, and brand team viewing it at once, which removes the version-control guesswork entirely.
The other gap is workflow. A demo tracking spreadsheet depends on someone manually emailing or calling to confirm an ambassador will show, then updating a cell to reflect it. Built-in confirmation workflows handle that automatically and flag no-shows before they become a surprise at the store. Compliance is similar: a spreadsheet tracks compliance with a loose photo attached to a row, if anyone remembers to upload it. Structured capture fields tie photos, timestamps, and checklist items to the specific event record, which matters when a retailer or finance team asks for proof later.
Generic project management software solves a different problem. It's built for internal task tracking, assigning work, setting due dates, checking boxes, not for retail execution. It has no concept of store-level geofencing to confirm an ambassador actually arrived, no ambassador-specific scheduling logic, and no fields for retailer compliance requirements. Those gaps are why CPG operations teams often patch together spreadsheets, project boards, and messaging apps rather than find one tool that fits, a pattern consistent with how CPG operations tend to break down at scale as more SKUs, channels, and retailer requirements pile onto the same patchwork of tools [2].
Store employees stop being the default contact for vendor questions once they have their own view into the calendar. Instead of a manager fielding "who's coming Saturday" calls from three different brokers, the schedule is visible to everyone who needs it, including store staff, without a single email.
On cost, the switch is budget-friendly relative to what coordination failures already cost in missed demos, idle ambassadors, and lost sales velocity during a weekend activation. A premium-tier enterprise suite may be overkill for a mid-market brand, but a mid-range dedicated platform, built specifically for in-store demo logistics, the way Demo Wizard combines scheduling, ambassador management, and ROI tracking in one system, typically costs far less than one missed roadshow weekend.
Yes, for a handful of monthly demos, a demo tracking spreadsheet can track schedules, store names, and basic sales notes without issue. Spreadsheets offer customization and flexibility that most small operators find sufficient at low volume [5]. The trouble starts once a coordinator manages multiple states, dozens of ambassadors, or more than a few events per week.
The clearest sign is spending more time reconciling the sheet than analyzing what it shows. If a coordinator needs a full day to merge store, ambassador, and sales data before any decision can be made, the spreadsheet has become the bottleneck rather than the solution [2].
Requirements vary by retailer and are set individually, not standardized industry-wide. Some chains ask for photo confirmation, check-in timestamps, or specific reporting templates tied to their own compliance systems. Brands should confirm format expectations directly with each retail partner rather than assume one spreadsheet layout will satisfy every account.
No, they measure different things. Sales velocity tracks units sold per store over time, a standard brick-and-mortar metric [4], while conversion in this context refers to how many shoppers who experienced a demo went on to purchase. Ecommerce-style "conversion rate" language doesn't map cleanly onto physical retail, where basket size and velocity are the more relevant measures for CPG brands and retail partners.
Some brands keep a demo tracking spreadsheet for quick notes while routing scheduling and compliance through a dedicated platform, but this hybrid approach tends to recreate the same reconciliation burden it was meant to avoid. Once staff assignments, compliance photos, and sales results live in different places, someone still has to manually align them, which is the core problem a spreadsheet-only system already has.

A spreadsheet works until the volume of stores, ambassadors, and reporting demands outgrows what one tab can hold without errors creeping in [2][1]. The fix isn't more columns, it's separating scheduling, compliance, and sales-impact data into a system built for multi-location coordination. Demo Wizard handles that by combining scheduling, ambassador payroll, and store-level ROI tracking in one platform, letting a single coordinator run hundreds of monthly demos without adding headcount. Before the next planning cycle, pull last quarter's demo tracking spreadsheet and count how many hours went into reconciling it versus acting on what it showed. That number is the clearest signal of whether it's time to move on.
Explore more from our content library:
Demo Wizard is the Ultimate Store Sampling & Demonstration management software for Brick and Mortar Retailers and CPG Vendors.
Chat with usPhone