
Demo Wizard is the Ultimate Store Sampling & Demonstration management software for Brick and Mortar Retailers and CPG Vendors.
Chat with us

Phone
Copyright © 2026 Demo Wizard
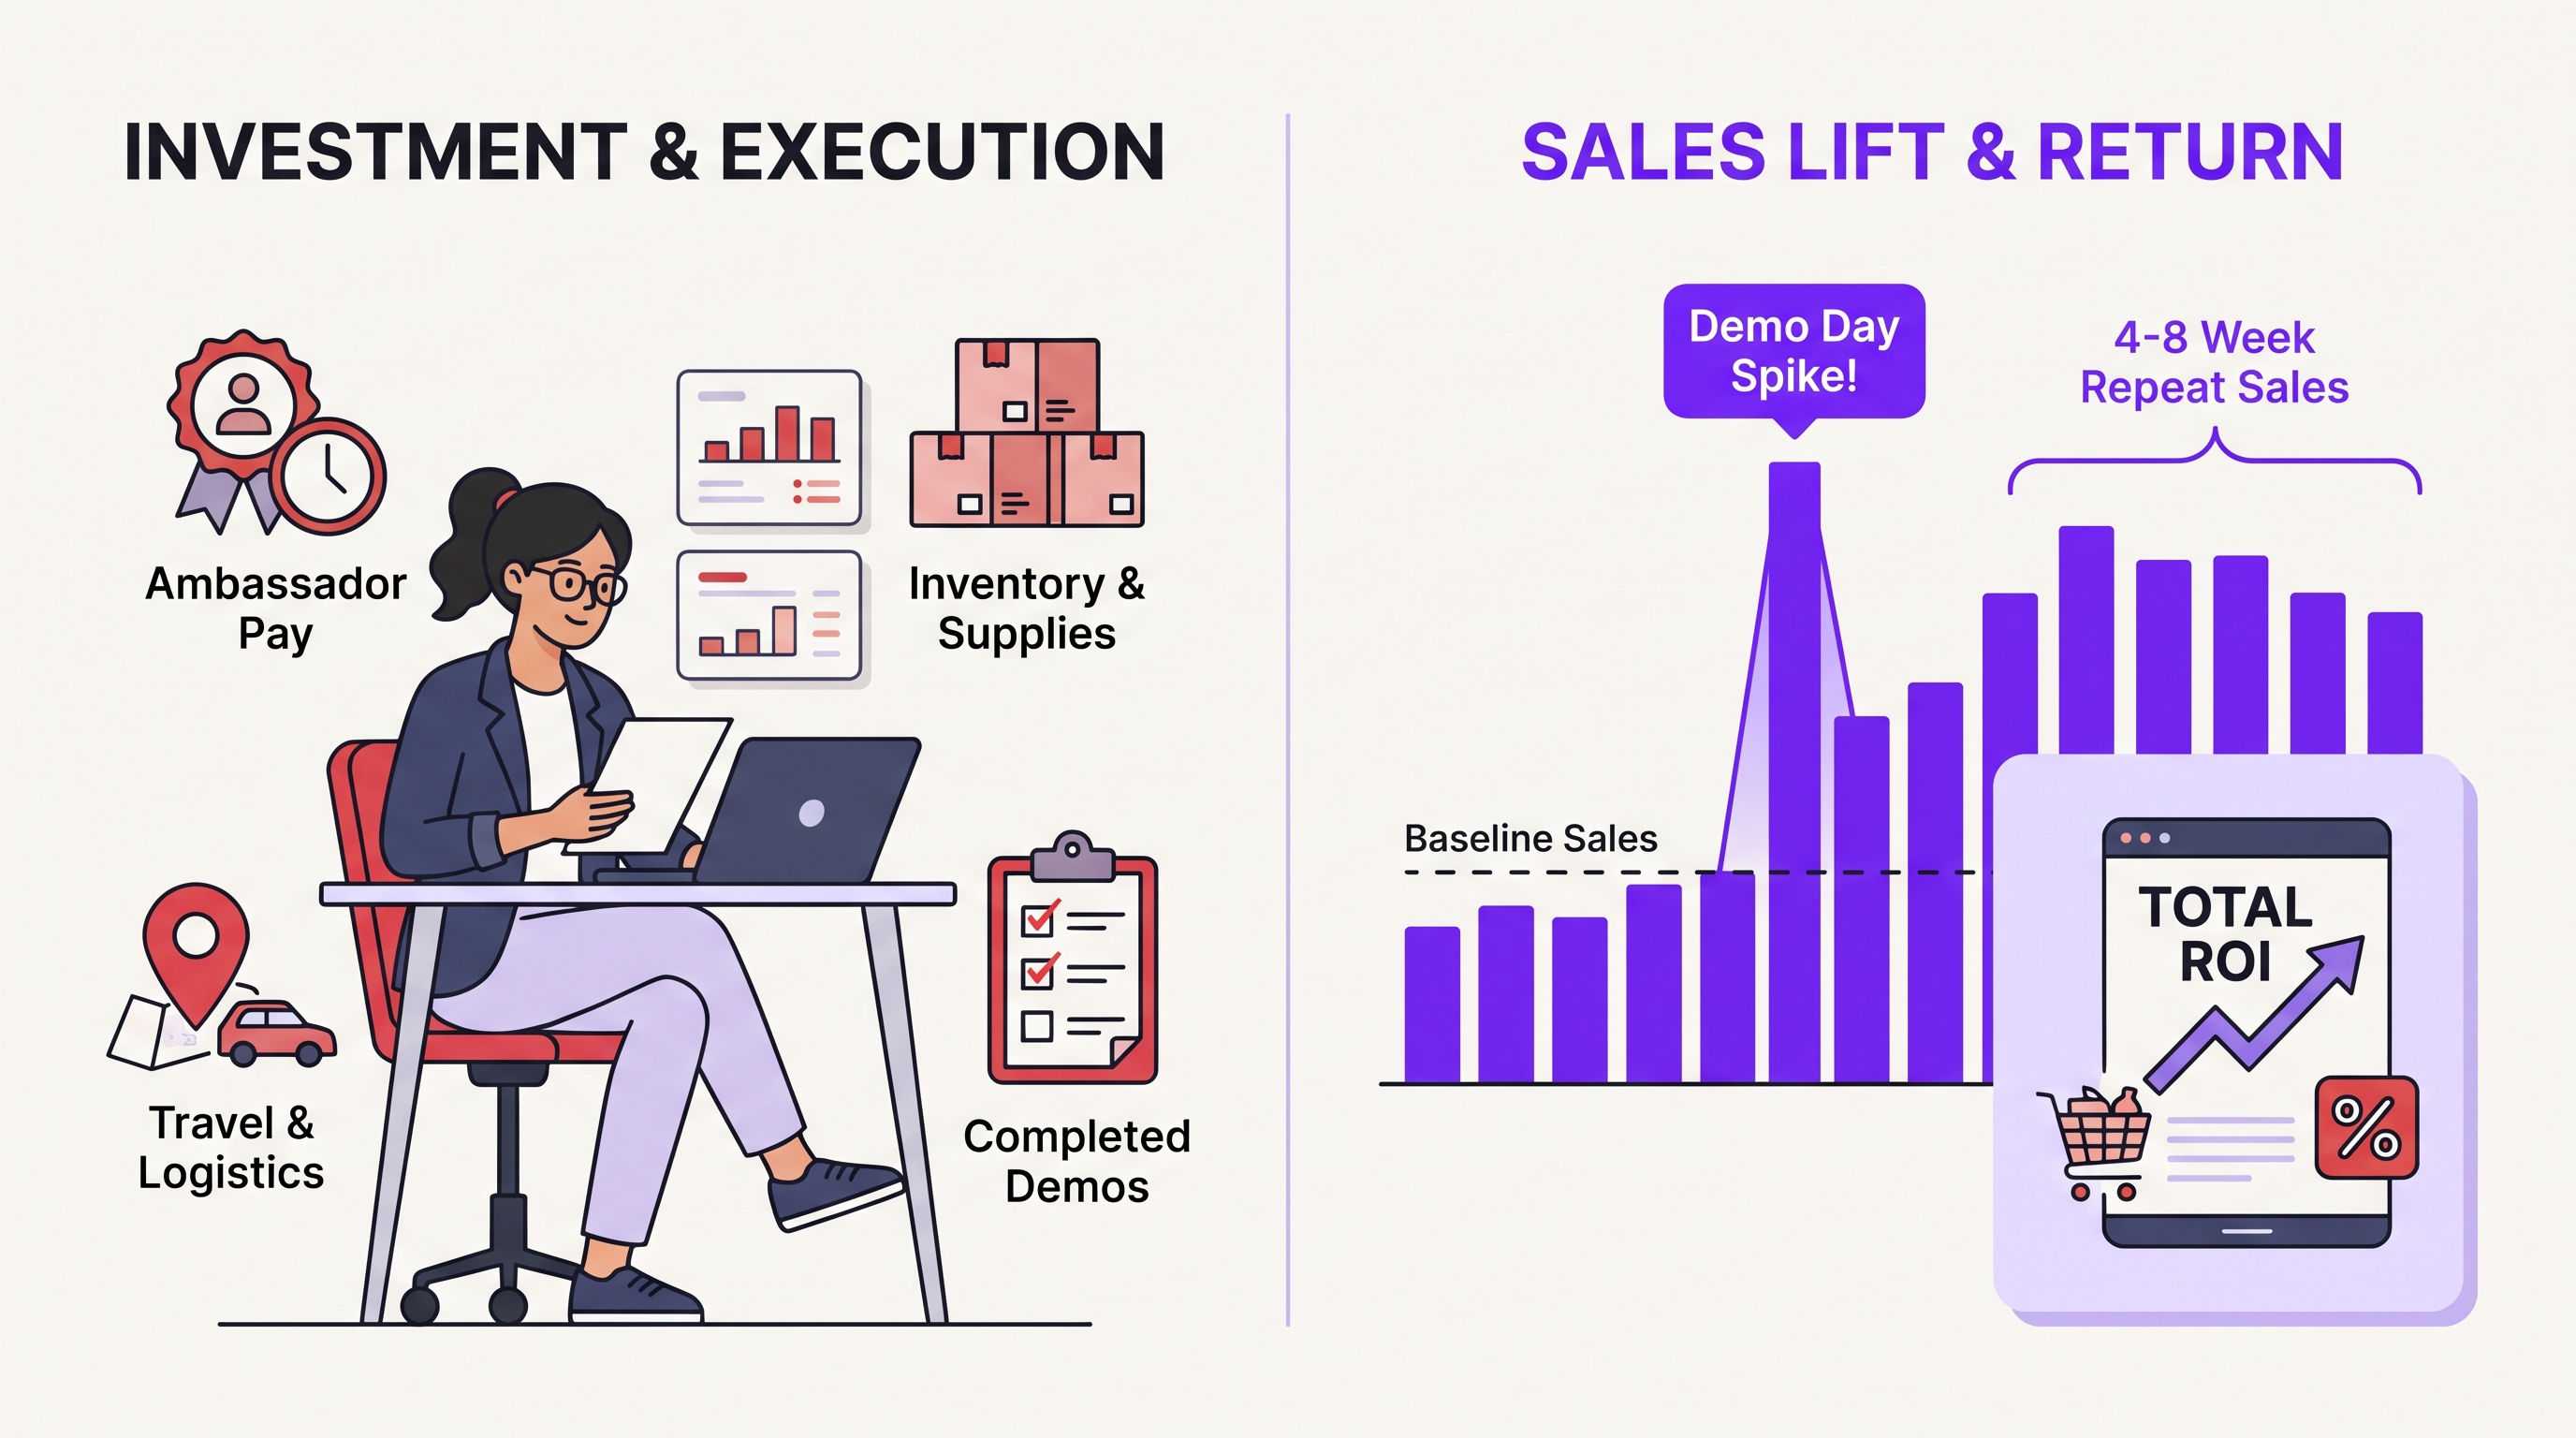
Measuring in-store product demo ROI requires looking beyond immediate event-day sales to track total event costs against direct conversions, baseline sales lift, and long-term customer repeat purchases.
Understanding how to track product demo ROI is essential. You track in-store product demo ROI by comparing the incremental sales lift during and after a demo event against its total cost, labor, product samples, and coordination overhead. The core formula is (demo-driven sales lift minus demo cost) divided by demo cost. Sales lift is measured by comparing a demo store's sales velocity against a similar non-demo store or the same store's pre-demo baseline over a matched time window, since brick-and-mortar brands rely on sales velocity and basket size.

Five numbers drive product demo ROI: consumer engagements, sales lift, BA taste-to-purchase ratio, cost per sample, and repeat purchase rate — everything else is operational or supporting information that can be used for optimization of the future efforts.
The ROI formula itself is simple: (sales lift minus total demo cost) divided by total demo cost. Consumer engagements, how many shoppers stopped, sampled, or asked a question, is the leading indicator of brand awareness, visible the moment a shift starts rather than days later. Sales lift is the incremental revenue a demo generates compared to a baseline, either the same store's pre-demo sales or a matched non-demo store over the same window. Cost per sample is not just the ambassador's hourly rate split across units given out, it should fold in payroll processing and the coordination time a brand manager or agency spends scheduling the event, confirming inventory, and following up. Brands that only count labor on the cost side consistently overstate their ROI.
Engagement, conversion, and repeat purchase all matter, but the taste-to-purchase ratio matters most because it isolates ambassador execution from location quality [[1]](#source-1).
Repeat purchase rate, whether a shopper who tried the product at the table buys it again on a later trip, is what separates a demo that built lasting brand awareness from one that only moved units for a day, and it matters when a brand is negotiating for more shelf space or a bigger promotional calendar.
On the cost side, cost-per-sample needs to be tracked per event, not averaged across a campaign. A four-hour Saturday shift at a high-traffic store and a slow Tuesday afternoon at a secondary location have very different cost efficiency, even if the campaign-wide average looks acceptable. Blending the two hides which shifts are actually worth repeating. For a broader list of metrics worth tracking beyond raw traffic counts, see this breakdown of metrics that prove retail demo ROI.
The metrics worth tracking per shift typically include:
Units sold per hour during the demo window is the clearest same-day signal a brand manager has, since full sales lift data often takes days to arrive from the retailer or distributor. If an ambassador logs 40 units moved in a three-hour shift at one store and 12 at another, that gap points to location or timing differences worth investigating before the next event is booked [[4]](#source-4). This is the leading indicator half of how to track product demo ROI, the lagging half is the sales data that confirms whether the lift held after the ambassador packed up.
Qualitative feedback, objections shoppers raised, questions they asked, whether they circled back for a second sample, adds context but should never substitute for the hard numbers. A shift can feel successful because the crowd was enthusiastic and still produce weak velocity if enthusiasm didn't convert to purchases.
Separate demo-driven sales from normal store traffic by comparing a matched control store against the demo store, or by comparing the same store's sales before and after the event.
This is the hardest part of how to track product demo ROI, because raw sales velocity during a demo day tells you almost nothing on its own. A spike could come from the demo, a weekend crowd, a price cut the category manager ran that same week, or all three at once. Brands need a method that strips out the noise.
Three confounding factors show up repeatedly: overlapping price promotions, weekend or holiday traffic spikes, and competing brands running their own demos in the same aisle. A frozen foods brand sampling on a Saturday afternoon next to a holiday weekend will see inflated sales that have little to do with the demo itself. If a competitor is sampling a rival product twenty feet away, the two activations can cancel out each other's lift or create a halo effect that's hard to credit correctly. None of these factors are visible from a sales report alone, they require a coordinator or brand manager to log what else was happening in the store that week, which is exactly the kind of operational detail that gets lost in spreadsheet-based tracking.
The cleaner method is a matched-store comparison: track sales velocity at the demo store against a similar store of the same banner, size, and region that ran no demo during the same window. If both stores see comparable traffic patterns but the demo store outperforms on the sampled SKU, that gap is a reasonable proxy for incremental lift [1]. Retailers with dozens of locations in a chain have no shortage of candidates for this kind of pairing.
When no comparable control store exists, common for independent grocers or single-door accounts, a before/after baseline works instead. Pull the same store's sales for a pre-demo period of equal length to the demo window, then compare. This won't fully isolate seasonality, but it's far more reliable than a single day's number viewed in isolation [1].
Either method works best with a narrow measurement window: the demo day itself plus a short follow-on period, typically a few days, to capture the frictionless taste-to-purchase behavior that makes in-store sampling effective without over-crediting sales that happened for unrelated reasons weeks later [4]. Both approaches depend entirely on sales data the brand or retailer already collects through POS or distributor reporting. A scheduling and coordination platform like Demo Wizard tracks experience-to-purchase conversion by store and time period, but it isn't a substitute for the underlying sales data source, it helps structure and interpret the numbers your existing systems produce. For a deeper walkthrough of this attribution process, see this guide on how to track demo ROI.
A good demo ROI depends on the product category, store format, and brand maturity involved, there is no single number that applies across the board.
Brands asking how to track product demo ROI often start by looking for an industry-wide benchmark. That search is usually a dead end, because the inputs that drive a demo's return differ too much from one campaign to the next. A more useful approach is to judge each demo against its own category, format, and goals, not against a borrowed percentage from a different kind of brand.
Product category sets the ceiling for same-day lift. Food and beverage items are high-trial by nature, a shopper can taste a sauce or a snack and decide in seconds, which is why sampling is standard practice in those aisles [2]. Categories that require more consideration, like small appliances or supplements, rarely convert at the table the same way; the demo's job there is more about education and reducing hesitation than driving an immediate cart add.
Store size and traffic patterns move the baseline too. An end-cap in a large-format store with heavy weekend foot traffic has a much higher lift ceiling than a table in a small independent grocer, simply because more shoppers pass by [1]. That does not make the independent grocer a weak placement, it means the comparison has to be store-to-store, not format-to-format.
Brand maturity changes what the ROI read should even look like. An emerging brand's demo is doing double duty: driving trial and building awareness, so some of its value shows up later in repeat purchases rather than same-day units. An established brand with shelf recognition should see its ROI concentrated almost entirely in same-day velocity, since awareness is already built.
Format and budget matter as well. A single-ambassador sampling shift and a multi-day roadshow activation are different investments with different success criteria, and judging a budget-friendly shift against a premium activation's unit targets will make the smaller campaign look worse than it is.
Once you know how to track product demo ROI, the real work starts: fixing the four or five operational levers that drag campaign averages down. None of them require new software, they require a standardized process applied every shift, every store.
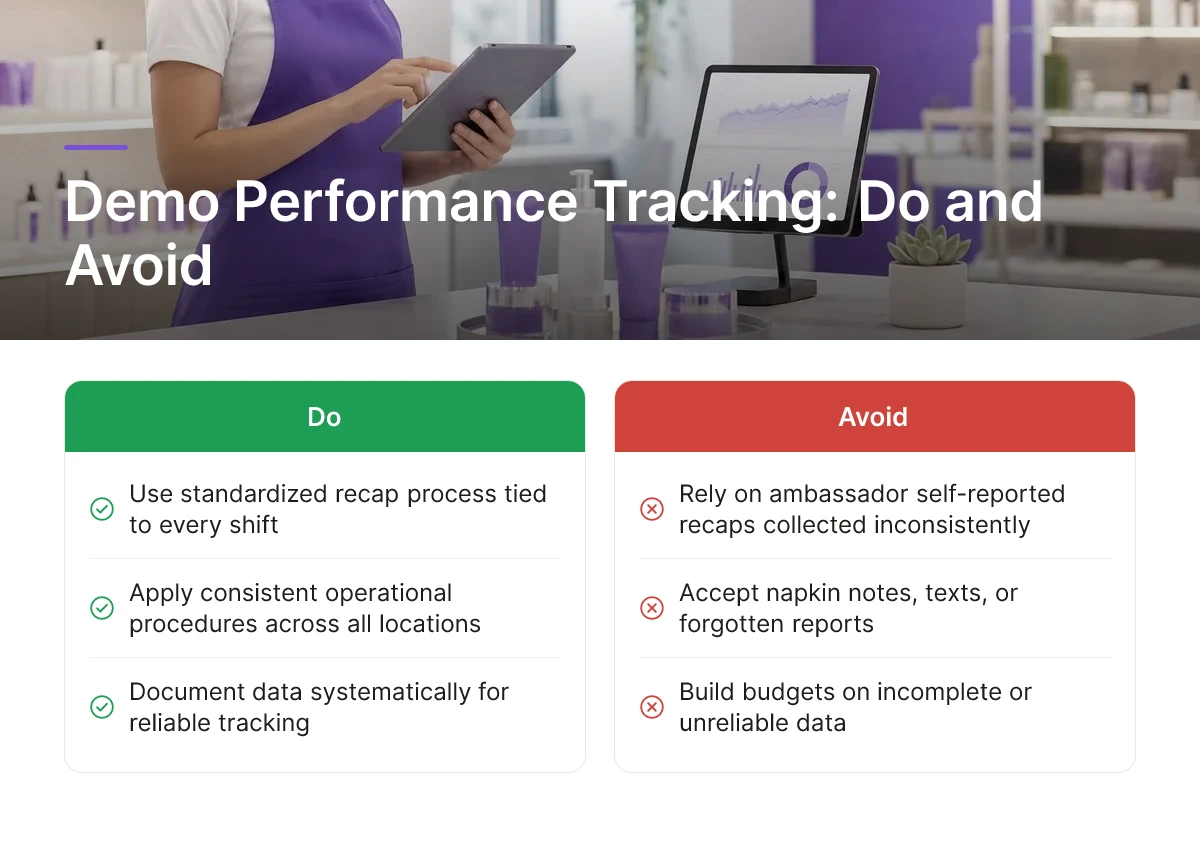
The single biggest mistake is relying on ambassador self-reported recaps collected inconsistently instead of a standardized recap process tied to every shift. One ambassador jots notes on a napkin, another sends a text, a third forgets entirely, and the brand ends up with a data set full of holes rather than a campaign record it can act on.
A standardized recap means the same fields, captured the same way, after every single shift: units sold, samples distributed, stock remaining, photo of the display, and a time-stamped check-in and check-out. Without that consistency, a brand can't tell whether a low-ROI week reflects a bad location, a bad ambassador, or simply a recap nobody filed.
Scheduling gaps and undertrained staff quietly cap ROI even when the product and the store are both strong performers on paper. A last-minute cancellation or no-show turns a scheduled shift into a zero-sales shift, and that zero drags down the average ROI across the whole campaign even when every other shift hit its numbers. Brands running demos across dozens of stores a month rarely catch this pattern without reviewing schedule adherence alongside sales data, store by store.
Ambassador quality matters just as much as showing up. A knowledgeable, well-briefed ambassador who understands the product's ingredients, sourcing, and benefits converts a taste into a purchase far more reliably than an undertrained staffer reciting a script, deep product knowledge is a documented best practice for roadshow-style activations precisely because it turns casual tasters into buyers. Attack! Marketing's guide to in-store demos backs this up directionally: products featured in retail demos often sell over 40% better than non-sampled items [2], but that lift depends on execution quality, not just the presence of a table. Their full breakdown of what separates strong and weak activations is worth reviewing in this guide to winning at in-store demos.
Two more levers round this out. Location and placement change the ceiling on what's achievable, a prime, high-traffic footprint near the entrance or checkout can outperform a back-aisle spot regardless of how good the ambassador is. And inventory forecasting sets the floor: a demo that sells out its stock by Saturday noon stops generating sales no matter how strong the morning's velocity was, capping upside the brand already paid labor costs to capture.
The fix is a centralized platform that standardizes scheduling, confirmations, and reporting once manual tracking breaks down past a handful of demos a month.
Spreadsheets and email chains work fine for five demos a month. At fifty or a hundred, they become the biggest source of unreliable data. A coordinator trying to reconcile three regional managers' inboxes to figure out which shifts actually happened, which were canceled, and which ambassador covered a last-minute swap is not producing numbers anyone should trust for a budget decision. Figuring out how to track product demo ROI at that scale starts with removing the manual steps where data gets lost or distorted before it ever reaches a spreadsheet.
A centralized calendar visible to brands, retailers, and ambassadors replaces scattered spreadsheets as the single source of truth for what happened at each shift. Everyone involved, the brand's activation manager, the retailer's store contact, and the ambassador on the floor, looks at the same record instead of three different versions of the schedule.
That same system can automate confirmation workflows, which reduce no-shows and last-minute cancellations before they cost anything. A confirmed ambassador who gets an automated reminder 48 hours and 24 hours out is far less likely to no-show than one relying on a manager remembering to call. This matters directly for ROI math: a canceled shift with product already shipped to the store is a cost with zero return, and it is exactly the kind of leak that never shows up until someone reconciles a quarter's worth of invoices. Demo Wizard builds this confirmation layer into its scheduling workflow specifically to protect the cost side of the equation before a shift ever starts.
Standardized digital recap forms, photos, units sold during the shift, shopper notes, replace inconsistent manual reporting so every event produces comparable data. When every ambassador fills out the same fields instead of texting a manager whatever they remember, a coordinator can finally compare store 12 against store 47 on equal terms.
Platforms like Demo Wizard coordinate and track this demo-side activity and cost data: schedules, attendance, recap forms, and ambassador payroll tied to completed shifts. The sales figures used for lift calculations still come from the retailer's or brand's own data sources, Demo Wizard does not pull from a store's point-of-sale system. That division of labor is worth stating plainly, because the platform's job is making the demo-side numbers reliable, not replacing the retailer's sales reporting. For additional perspective on how conversion rates are typically measured and improved, see these tips to improve demo conversion rates.
There's a cost that rarely makes it into any ROI spreadsheet: the hours a store employee spends fielding vendor calls, approving ambassador check-ins, or chasing down a no-show replacement. Reducing that involvement lowers a hidden labor cost that otherwise never gets counted in a demo's true cost, and it's often the difference retailers notice first.
Yes, most CPG brands track demo ROI using sales data pulled from retailers or third-party data providers rather than a direct POS feed. Demo Wizard, for example, ingests this external sales data and matches it against scheduled demo dates, times, and store locations to calculate sales velocity lift, without requiring a POS integration on the brand's end.
Measure sales velocity for at least 7 to 14 days after a demo to capture both the immediate spike and any fade-out effect. A single-day snapshot overstates impact because shoppers who sampled on Saturday may not purchase until a return trip the following week.
Yes, roadshows need day-by-day tracking, not just a campaign-level total, because performance usually varies across the 3-to-10-day window. Brands should watch units sold per hour by day to catch inventory gaps mid-run, then compare the full roadshow's sales velocity lift against a single sampling shift to justify the added labor and staging cost.
Store employees confirm that a demo happened as scheduled, which protects the integrity of the sales data used to calculate ROI. Platforms built for this, like Demo Wizard, reduce how much coordination falls on store staff, but a manager's quick confirmation still matters for flagging no-shows or canceled slots that would otherwise skew the numbers.
A useful report pairs the sales lift calculation with the cost breakdown it was measured against, broken out by store and shift rather than blended into one campaign average. It should also flag any confounding factors, like concurrent promotions or competitor activations, so leadership can judge the number with the right context instead of treating it as an isolated figure.
Tracking product demo ROI comes down to three habits: measure the right numbers, segment results instead of averaging them, and centralize data collection instead of reconciling spreadsheets after the fact.
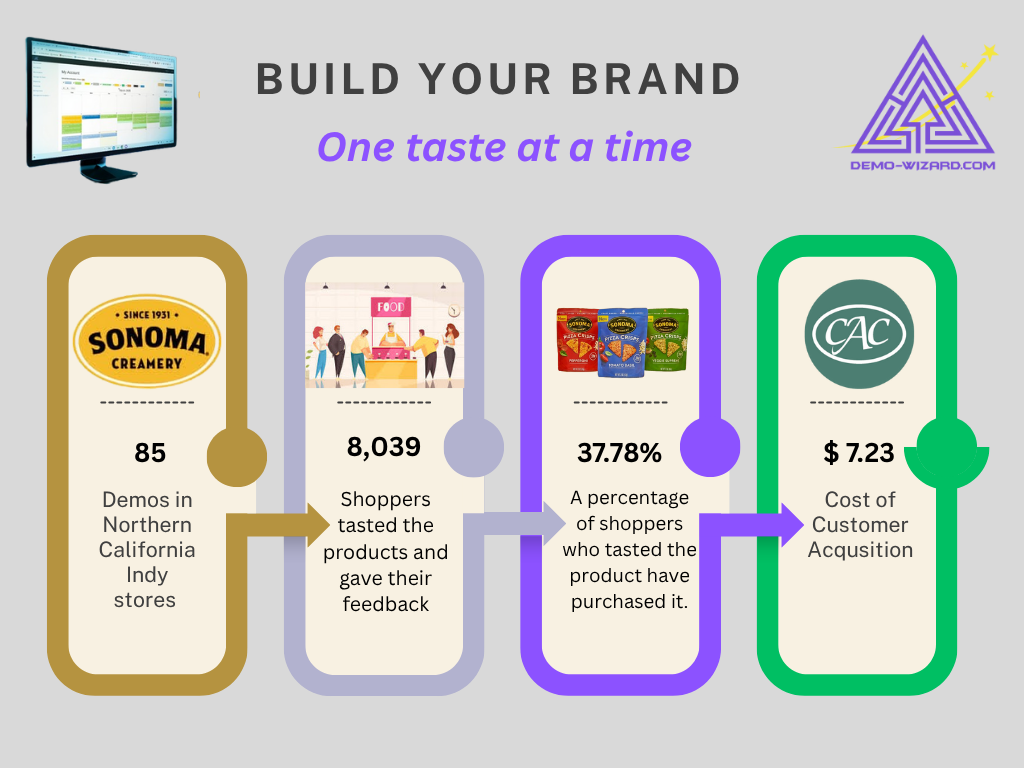
The five core numbers, consumer engagements, sales lift, taste-to-purchase ratio, cost per sample, and repeat purchase rate, should be measured against a matched comparison period before the campaign starts. Segment results by store traffic, store-level conversion ratio, and demo date/time frame instead of averaging everything together, and feed ambassador and scheduling data into one system so coordinators aren't reconciling spreadsheets after the fact. Brands running a handful of demos a month can manage this manually. Brands running hundreds across multiple states need a platform built for it, Demo Wizard combines scheduling, ambassador management, and post-demo analytics so a single coordinator can see which stores and times are worth repeating. Start by pulling your last 90 days of demo dates and matching them against store-level sales data to find your first real lift number.
Explore more from our content library:
About the Author
Written by Gregory Yankelovich. This article was conceptualized, directed, and reviewed by our human team of retail marketing veterans. Every strategy, framework, and recommendation originates from the hands-on expertise of our experts. Human insight drives the core narrative, ensuring all advice remains grounded in real-world retail execution. AI assistance was used to streamline production and optimize for generative engine optimization (GEO).
Demo Wizard is the Ultimate Store Sampling & Demonstration management software for Brick and Mortar Retailers and CPG Vendors.
Chat with usPhone