
Demo Wizard is the Ultimate Store Sampling & Demonstration management software for Brick and Mortar Retailers and CPG Vendors.
Chat with us

Phone
Copyright © 2026 Demo Wizard
Understanding Customer acquisition cost for brick and mortar CPG is essential. Customer acquisition cost for brick-and-mortar CPG brands is calculated by dividing total demo or sampling program spend—staffing, product, materials, and coordination overhead—by the number of new buyers converted at shelf. Unlike digital CAC, which relies on click attribution, in-store CAC depends on tracking sampled shoppers against point-of-sale lift during and after the activation window. Brands that isolate per-store, per-format costs (tray sampling vs. multi-day roadshows) can compare efficiency across locations and staff, then reallocate budget toward the formats and stores producing the lowest cost per converted buyer.
Building an accurate formula for customer acquisition cost for brick and mortar CPG requires five cost inputs and a conversion signal tied to point-of-sale data, not clicks.
Digital CAC models rely on pixels, UTM tags, and attribution windows measured in days. None of that exists on a store floor. A shopper who samples a product on Saturday and buys it the following Tuesday leaves no digital trail, the only proof is what scanned at the register. That gap is why brands running in-store activations need a formula built from actual program costs and shelf-level sales data, not a borrowed digital template.
Five line items belong in every in-store CAC calculation, and skipping any of them understates true cost.
That last input is easy to overlook, but it's often the biggest hidden cost. A coordinator manually juggling spreadsheets for 40 stores a month is spending real, billable hours that belong in the denominator of the cost equation, not off the books. Platforms like Demo Wizard fold ambassador payroll and scheduling into one system specifically so that admin time gets tracked rather than absorbed silently into overhead.
Conversion should be measured through point-of-sale unit lift during and immediately after the activation window, not through any form of click or link tracking [5]. Retailers that offer loyalty card or basket-level data give brands the clearest picture: matching timestamped purchases against the demo's active hours shows how many baskets included the sampled product versus a typical day. Products featured in retail and in-store demos often sell over 40% better compared to non-sampled items [3], which makes the lift itself detectable even without individual shopper tracking.
When loyalty or basket data isn't available, common with independent grocers or smaller chains, the workable proxy is unit velocity lift: comparing units sold per hour during the activation against the same store's baseline sales in a comparable prior period.
Cost-per-sample and cost-per-acquired-customer are not the same number. A table that hands out 500 samples in a day has a low cost per sample, but if only 60 of those baskets convert to a purchase, the acquisition cost is calculated against 60 buyers, not 500 tastes [2].
Customer acquisition cost for brick and mortar CPG changes with footprint size, staffing hours, product category, and retailer type, there is no single benchmark number that applies across a brand's portfolio.
A standard tray sampling event, one ambassador, a folding table, four hours on a Saturday, has a low cost base but also a capped reach: maybe 150 to 300 shoppers sampled in a shift. A multi-day roadshow, by contrast, occupies a dedicated footprint for three to ten days, requires trained ambassadors who can close sales rather than just hand out samples, and often includes bundled offers or bulk sizes not on the regular shelf. The roadshow costs far more per event, but it can also convert thousands of shoppers into buyers in a single weekend, which frequently produces a lower cost per acquired customer once the volume is accounted for. The math only works if the brand tracks units sold per hour against the fully loaded cost of the footprint and staff, not just the cost of samples handed out.
Store traffic and placement matter just as much as format. An end-cap or entrance location near checkout queues sees dramatically more foot traffic than a back-aisle table, and prime placement can double conversion rates compared to secondary locations, which directly compresses acquisition cost. A demo buried in a back aisle might generate polite interest; the same demo at the front of the store, timed for weekend peak hours, converts browsers into buyers before they've filled their cart.
Perishable food and beverage products tend to convert faster than shelf-stable goods because tasting removes the guesswork, a shopper who likes the flavor buys, often within minutes [3]. Shelf-stable items, supplements, or household goods usually need more explanation from the ambassador, which slows the sales cycle and raises the labor cost per conversion even when the footprint cost is identical.
Retailer type adds another variable. Warehouse clubs deliver high footfall and bulk-purchase behavior but charge more for premium placement; regional grocery chains offer moderate traffic at lower negotiated footprint costs; specialty stores bring a smaller, more targeted audience that can convert at a higher rate despite lower volume. Brands and agencies coordinating dozens of these variables monthly need visibility into which combination, format, location, and retailer, actually produces the lowest cost per acquired customer, which is where store-level and time-of-day performance tracking through a platform like Demo Wizard becomes the difference between guessing and knowing.
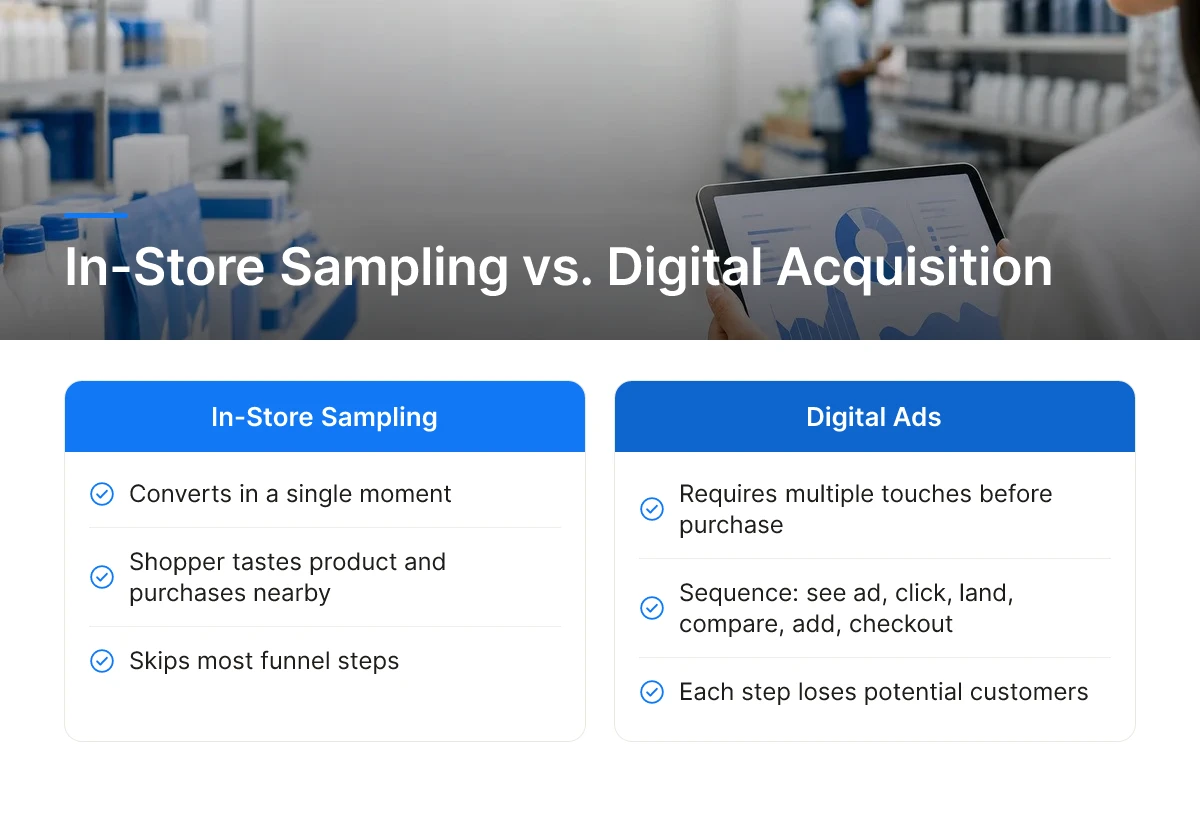
In-store sampling converts in a single moment while digital ads require multiple touches before a purchase, making customer acquisition cost for brick and mortar CPG behave differently than a paid media budget.
A digital funnel typically asks a shopper to see an ad, click, land on a product page, compare, add to cart, and check out, a sequence where each step loses people. A well-placed in-store demo skips nearly all of it. A shopper tastes the product and grabs it from the display pallet a few feet away, converting trial to purchase in the same visit, sometimes the same minute [3].
Digital acquisition costs also compound over time. As more brands bid on the same keywords and audiences, cost per click and cost per impression rise, and ad fatigue pushes conversion rates down even as spend holds steady [2]. In-store activation costs behave differently. A brand paying a flat rate per demo or per sampling event, structured through a platform like Demo Wizard at a set cost per demo, sees a cost curve that stays flat as long as store traffic and ambassador execution hold steady, it does not creep upward the way auction-based digital bidding does.
A single sampling event looks expensive only if you measure it against one transaction. The math changes once a sampled shopper becomes a repeat buyer, the same logic marketers use to justify digital ad spend against retained-customer value applies here, just with a shorter path to the first purchase [2]. A higher upfront cost per demo is easy to justify when post-demo tracking shows that converted shoppers keep buying the product on later store visits.
In-store trial also produces something digital acquisition cannot: a direct relationship with the retailer. A roadshow or demo series that drives strong weekend sell-through gives a brand use to negotiate permanent shelf space, a benefit that compounds independently of any single customer's lifetime value. Digital acquisition earns a customer; in-store acquisition can earn both a customer and a retail partner.
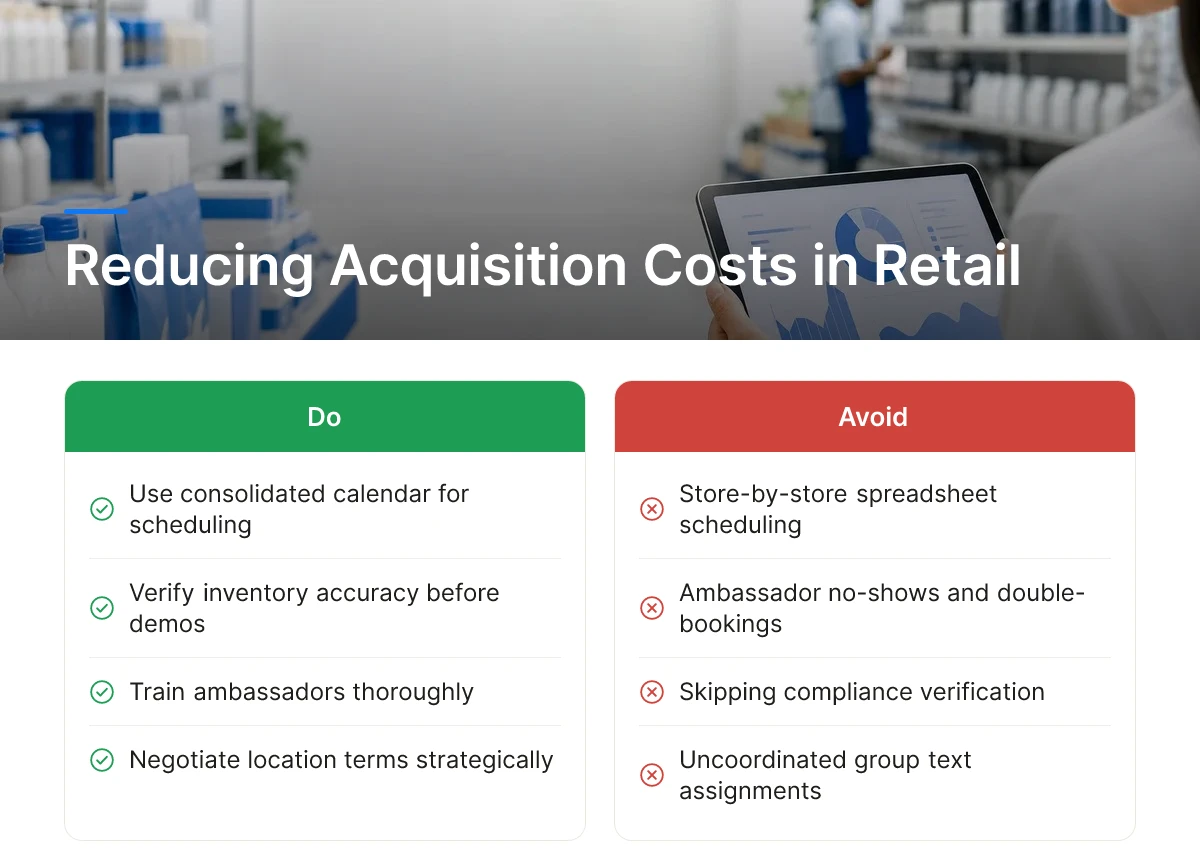
Five operational levers cut customer acquisition cost for brick and mortar CPG without reducing how many stores or shoppers a brand reaches: scheduling discipline, inventory accuracy, compliance verification, location negotiation, and ambassador training.
A consolidated calendar prevents the two most common budget leaks in retail activation: no-shows and double-bookings. When a brand or agency schedules demos store-by-store in spreadsheets and group texts, it is common for two ambassadors to be assigned the same slot while another store goes uncovered entirely, both scenarios burn payroll without producing a single conversion.
Centralizing scheduling across every location gives a coordinator one view of ambassador availability, store commitments, and confirmed bookings. Demo Wizard was built around this exact problem: it automates coordination across multiple retail locations so a single coordinator can manage hundreds of monthly events without hiring additional staff. Fewer wasted ambassador hours means the fixed labor cost of a campaign gets divided across more completed, revenue-producing demos, which is the direct mechanism for lowering blended cost per acquisition.
Compliance verification lowers acquisition cost by making sure the demo that gets paid for actually happens correctly the first time. Geo-fenced check-ins confirm an ambassador arrived at the right store at the right time, and photo verification of table setup and signage gives brand managers proof the activation matched the plan, both reduce the disputes and re-scheduled "make-good" demos that quietly double labor spend on a single store visit.
Compliance also correlates with sales lift itself. A demo table set up correctly, in the agreed location, with proper signage and product staging, converts more foot traffic than one thrown together late or moved to a back corner. Accurate inventory forecasting matters here too: running out of product mid-Saturday afternoon means every shopper who walks by afterward represents foot traffic the brand already paid ambassador wages to capture, with nothing to sell them [3].
Location negotiation is a lower-cost lever than most brands realize. Securing space near a store entrance, checkout queue, or center aisle raises conversion without raising campaign spend, the ambassador, the samples, and the hours are the same; only the traffic passing the table changes. Prime placement can meaningfully outperform back-aisle spots, since a demo already sells over 40% better than a non-sampled product when it captures the shopper's attention at the right moment [3].
Staff training closes the loop. An ambassador who can answer sourcing and ingredient questions confidently closes more sales per shift than one reciting a script, which lowers the blended cost per acquired customer across the whole campaign [1]. Together, these five levers form a practical answer to customer acquisition cost for brick and mortar CPG: fix the operations, and the cost curve follows.
Automated scheduling and reporting tools remove the manual guesswork from tracking spend, giving brands per-store cost visibility that spreadsheets simply can't produce accurately.
Calculating this approach starts with the right per-activation metrics, tracked consistently across every store and every event. At minimum, brands need units sold during the demo window, cost per unit sold, and cost per new buyer, the last one requiring some estimate of trial-to-purchase conversion rather than raw sample counts. Where retailer data allows, repeat scan-back rate in the weeks following an activation shows whether a sampled buyer became a repeat one, which is the real signal that acquisition spend worked. Brands that only track samples distributed, without connecting to units sold, are measuring activity instead of acquisition [2].
Manual, spreadsheet-based demo programs hide cost inside categories that never make it into a CAC calculation. A coordinator's hours spent emailing ambassadors, chasing store manager approvals, and scrambling to find a same-day replacement when someone no-shows rarely get allocated back to the specific activation that created the work. That means the true cost per store is almost always higher than the reported cost, because the labor behind the scenes gets buried in general marketing overhead instead of the event it supported.
Automated scheduling and centralized communication change this by putting ambassadors, distributors, and store staff on one coordinated system instead of scattered phone calls and email threads. When a shift needs backfilling or a store changes its available window, the platform routes the update instead of a coordinator manually re-confirming with three separate parties. That recovered time is exactly what let one coordinator manage hundreds of monthly events without the agency or brand hiring additional staff, the same coordination hours that used to disappear into overhead now show up as capacity for more activations.
Real-time dashboards then let brand teams compare CAC across stores side by side, instead of reconstructing it manually weeks later. A brand running 40 demos a month across three regions can see which locations produce the lowest cost per new buyer and route future budget there, rather than repeating a flat calendar of events regardless of performance. This is the specific gap a coordination platform like Demo Wizard is built to close: automating the scheduling and post-demo reporting layer so a brand sees true cost per acquisition per store, without needing to add a coordinator every time the program scales [3].
Include ambassador wages, product used as samples, travel and shipping, store fees, and any coordination overhead. Many brands undercount by leaving out payroll administration and the coordinator hours spent building schedules by hand. A platform like Demo Wizard bundles ambassador payroll and scheduling into one system, which makes it easier to see the true all-in cost per demo rather than guessing at labor overhead separately.
Compare unit sales at the demo store during the activation window against a baseline period or a similar non-demo store nearby. Point-of-sale lift is the clearest signal, though it requires store-level sales data tied to specific dates and times. Demo Wizard's post-demo analytics report experience-to-purchase conversion by store and time period, so brands don't have to reconcile spreadsheets manually [2].
Per-event cost runs higher, but per-acquired-customer cost is often lower because roadshows concentrate high-traffic footprint, trained ambassadors, and bundled offers into one push. A weekend roadshow can convert thousands of shoppers in a single high-traffic location, spreading fixed setup costs across far more trial-to-purchase moments than a single-table demo.
Blending is possible but requires care, since digital CAC formulas assume trackable clicks and conversions that don't map cleanly onto in-store trial [5]. Most brands are better served tracking in-store CAC separately by store and time period, then comparing channel efficiency side by side rather than forcing one blended number.
Lowering customer acquisition cost in brick-and-mortar CPG starts with treating every demo as a measurable transaction, not a goodwill gesture. Track cost per demo against store-level sales lift, compare performance across locations and times, and use that data to concentrate budget on the combinations that convert. Roadshows and standard sampling both have a place, but only if you can prove which one earns its spot on the calendar.
Start by pulling your last quarter's demo schedule and matching it against store-level sales data for those same dates, the gaps you find will show you exactly where your acquisition cost is hiding.
Explore more from our content library:
Demo Wizard is the Ultimate Store Sampling & Demonstration management software for Brick and Mortar Retailers and CPG Vendors.
Chat with usPhone