
Demo Wizard is the Ultimate Store Sampling & Demonstration management software for Brick and Mortar Retailers and CPG Vendors.
Chat with us

Phone
Copyright © 2026 Demo Wizard
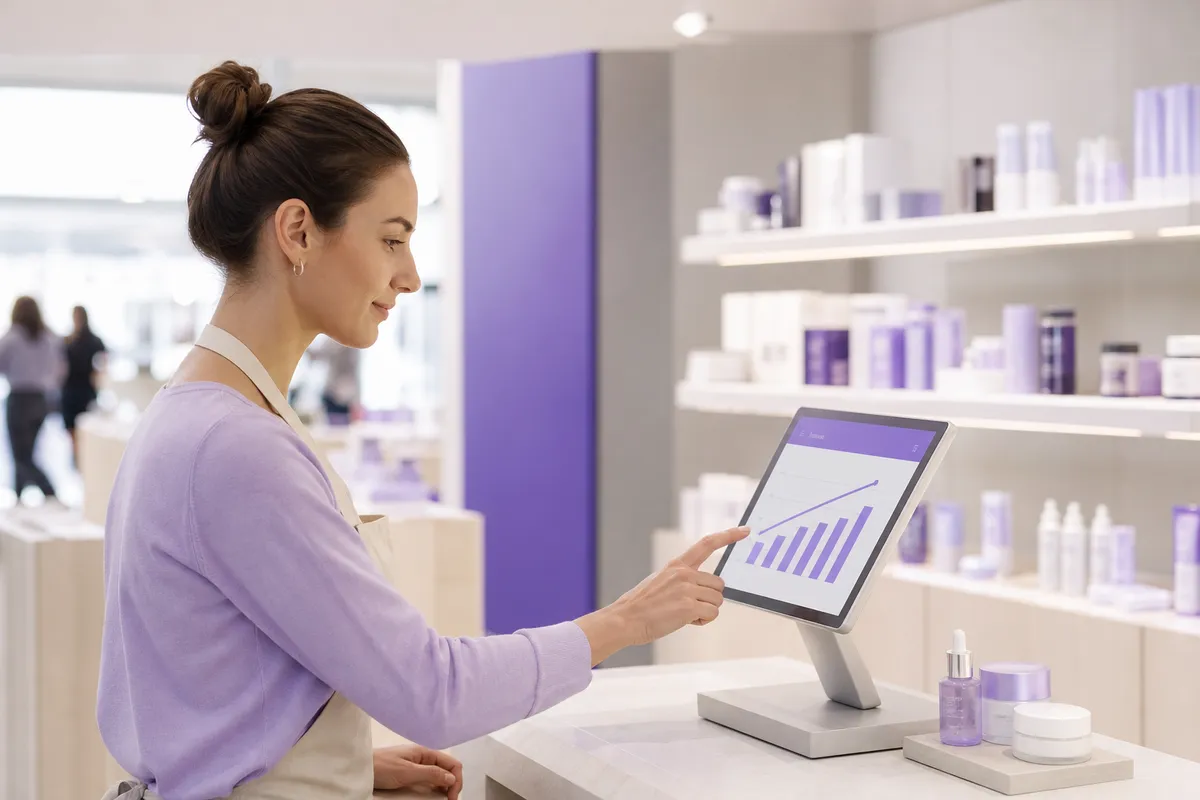
In-store demo sales velocity measures how quickly a product demonstration converts a shopper standing at the table into a shopper carrying the product to checkout. It combines three factors: how many shoppers engage with the demo, how fast that engagement turns into a purchase decision, and how much revenue each demo event generates per hour staffed. Unlike general retail traffic metrics, demo sales velocity isolates the direct cause-and-effect between a brand ambassador's interaction and a basket addition, giving CPG brands and retailers a concrete way to compare one activation against another and justify where to invest future demo budget.
Sales velocity in this context is a single shift's engagement rate, conversion speed, and revenue-per-hour rolled into one measure of demo performance. It tells a brand activation manager not just whether a demo happened, but whether it worked fast enough to justify the labor cost behind it.
Three inputs make up the number. First, how many shoppers stopped at the table versus how many walked past. Second, how quickly those engaged shoppers moved from sample to cart, some products close in under a minute, others need a longer conversation. Third, total units or dollars sold divided by the hours an ambassador was staffed. A demo that converts fast but draws few shoppers won't outperform one with lower conversion but heavier traffic; velocity only means something when all three factors are read together.
Conversion speed matters because ambassador wages and product giveaway cost are fixed for the shift regardless of how many units sell.
A four-hour shift costs roughly the same whether it produces 20 purchases or 80. Faster conversion per interaction means more transactions fit into that same paid window, which directly protects margin on a cost structure that doesn't flex with results. This is the commercial reason brand activation managers care about velocity more than raw attendance: a demo that pulls a crowd but converts slowly can still underperform a quieter one that closes shoppers quickly. Industry pricing guides note that in-store demo programs are judged on this kind of measurable return rather than activity alone [1].
Demo sales velocity isolates a direct, observable purchase decision, while impressions and foot traffic only measure exposure that may or may not lead to a sale later.
An end cap display or a shelf-talker might generate brand recall that shows up in sales weeks later, if at all, there's no clean line connecting the two. A staffed demo removes that lag. The ambassador's pitch, the sample, and the basket addition happen in the same few minutes, at the same table, which is why this moment is worth measuring on its own rather than folding it into broader awareness metrics. Research on product demonstrations backs this mechanism: step-by-step, process-focused demos have been shown to outperform outcome-only presentations because walking a shopper through how a product works builds the confidence needed to convert quickly [4].
Because the unit of measurement is the event, one roadshow, one sampling shift, one store visit, it can be tracked individually and then rolled up across stores, regions, or an entire campaign to compare which locations and time slots actually move product.
Measuring sales velocity from a demo means tracking how fast shoppers move from sample to sale, divided by the hours the activation ran, then comparing that rate to a non-demo baseline in the same store.
Sales velocity for an in-store demo breaks down into four numbers: shoppers engaged, units sold during the activation window, total revenue generated, and the hours staffed. Divide units sold by hours staffed to get units-per-hour, a direct measure of how fast the demo converts foot traffic into purchases. Divide revenue by hours staffed to get revenue velocity, the figure that lets a brand activation manager compare one store's Saturday shift against another market's Tuesday afternoon slot.
This math only means something next to a baseline. Pull the same store's unit sales for a recent non-demo period, ideally the same day of week, same number of hours, two or three weeks prior, and subtract it from the demo-window total. What's left is the lift the activation actually caused, not just normal category movement. Skipping this step is the most common reason demo ROI numbers get challenged by finance: a brand manager who reports "200 units sold Saturday" without a baseline can't prove the demo caused that number instead of a weekend traffic spike. Research across in-store demo programs consistently finds that demoed products sell well above non-sampled items during the activation window, but the exact lift always depends on isolating the test period against a clean comparison window [5].
Trustworthy velocity numbers depend on what gets captured at the table, not what gets reconstructed afterward. Four data points matter most: exact start and end time of the shift, units sold, a foot traffic estimate for the store during that window, and photo or compliance confirmation that the activation actually ran as scheduled. Missing any one of these turns the ROI calculation into a guess. This is where the measurement method itself becomes the bottleneck. Paper logs and end-of-week spreadsheet reconciliation mean a regional manager often doesn't see conversion numbers until days after the event, too late to reassign an underperforming time slot or restock a store that sold out early. Demo Wizard's approach replaces that lag with ambassadors logging start/end times, units sold, and compliance photos directly from the floor, so performance data by store and time period rolls into the dashboard as the event closes rather than the following week. Brands evaluating a coordination platform should run it against a baseline month of spreadsheet-tracked events first, same stores, same demo frequency, to see the real difference in reporting speed and data completeness before scaling to hundreds of monthly activations.
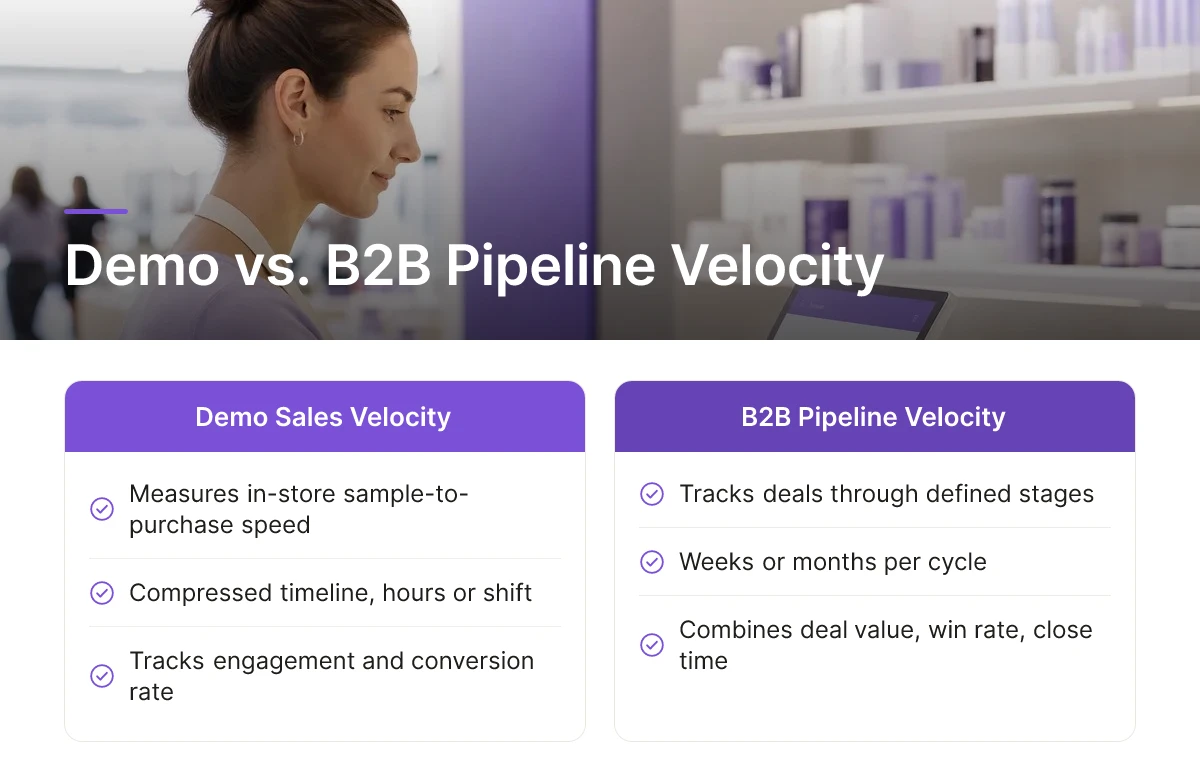
Demo sales velocity and B2B sales pipeline velocity share a name but measure completely different processes on completely different timelines.
In B2B sales, pipeline velocity tracks how fast deals move through defined stages, prospecting, qualification, proposal, negotiation, close, usually over weeks or months. The standard formula combines number of qualified deals, average deal value, win rate, and length of sales cycle to produce a dollar figure per period. A sales operations team watches days-to-close and deals-closed-per-quarter to judge whether the pipeline is healthy or clogged.
In-store demo sales velocity compresses that entire process into a single session. There's no multi-week cycle of emails, calls, and follow-up meetings. A shopper walks up to a demo table, samples or tries the product, asks a question, and either places it in the cart or walks away, all inside a few minutes. The "pipeline" from awareness to purchase decision happens at the table, not across a quarter.
CPG brands can't borrow the B2B formula because the underlying data doesn't exist in the same form. There's no named buyer, no CRM record, no deal stage to update. What exists instead is observed shopper behavior at a fixed location and time: how many people stopped, how many sampled, how many bought before leaving the aisle. Research on in-store demonstrations backs this up, process-focused demos that walk shoppers through how a product works tend to outperform demos that only show the end result [4], which is a finding specific to physical, in-person interaction and has no real B2B pipeline equivalent.
That's also why sales velocity in the demo context gets measured per store, per shift, per hour rather than per sales rep or per quarter. A platform like Demo Wizard tracks this at the event level, units sold against footfall and dwell time for a specific location and time slot, because that's the only data a demo actually generates.
Despite the mechanical differences, both metrics chase the same outcome: more revenue, faster, from the same investment of people and time. That shared goal is exactly why the terminology overlaps, even though a demo coordinator and a sales operations director are reading completely different numbers.
Automated platforms raise sales velocity by removing the scheduling gaps, compliance blind spots, and manual coordination work that silently drain conversion minutes from every demo shift.
Conversion only happens when a trained ambassador is standing at a stocked, properly set-up table while shoppers are walking by. Every gap in that chain, an unstaffed slot, a missing display sign, an empty product case, is lost sales velocity that no amount of post-event reporting can recover.
Centralized scheduling closes the first gap. When one system holds every store's calendar, ambassador availability, and shift confirmation in one place, double-bookings and unstaffed tables become visible before they happen rather than after a brand manager gets a complaint. Demo Wizard's scheduling layer coordinates bookings across multiple locations from a single dashboard, so a coordinator managing hundreds of monthly events can spot a coverage hole on a Tuesday afternoon in Ohio as easily as one in a flagship store in Texas.
Compliance automation closes the second gap. Photo confirmation, check-in and check-out timestamps, and setup verification catch the problems that quietly suppress conversion during a live event, a sign that never went up, a table placed in the wrong aisle, product stacked behind a pillar. Industry guidance on running effective in-store demos consistently flags setup and placement errors as a recurring cause of underperforming shifts [1], which is exactly the kind of failure automated check-ins are built to catch in real time, not three weeks later in a recap deck.
Inventory visibility tied to the same calendar closes the third gap. When product supply data lives next to the schedule, a coordinator can see a shift at risk of running out of stock before the Saturday rush hits, rather than hearing about it Monday morning after momentum has already died.
The fourth gap is administrative: every email chain between store staff, ambassadors, and distributors to confirm a time slot or chase a signature is time not spent engaging shoppers. Cutting that back-and-forth shifts ambassador attention back to the table.
For the retailer, the payoff is structural. A shared calendar visible to store managers, vendors, and ambassadors means store employees stop fielding vendor coordination calls and start simply managing a schedule they can see, protecting both their time and the in-store conditions that drive sales velocity at the shelf.
Four numbers tell most of the story: units sold per hour, the conversion rate of engaged shoppers to buyers, revenue per demo event, and the repeat-booking rate for your best-performing locations.
Together, these metrics turn a single demo from an isolated event into a data point you can act on. Units sold per hour shows raw momentum during the shift. Conversion rate, the share of shoppers who stopped, sampled, and then bought, shows how persuasive the interaction actually was, not just how busy the aisle looked. Revenue per demo event ties the activation back to dollars, which is what finance and retail partners actually ask about. Repeat-booking rate flags which stores and ambassador teams earn another slot on the calendar, because they've already proven they convert.
Comparing performance across stores and categories works better as pattern-spotting than benchmark-chasing. A demo in a high-traffic urban grocery store will naturally post different numbers than one in a suburban club location, comparing the two against a single universal target obscures more than it reveals. Instead, look for which store formats, end-cap placements, or dayparts consistently outperform others within their own category. A beverage brand running weekend tastings, for example, might find that Saturday afternoon slots in stores with front-of-store placement outperform weekday evening slots by a wide margin, regardless of what the "average" demo looks like nationally.
Treat each demo as one data point in a rolling set, not a verdict on its own. Reviewing the last 10 to 20 events at a given store or across a region, rather than reacting to any single Saturday, makes it easier to see whether a slow shift was a staffing issue, a bad time slot, or just an off day. Platforms like Demo Wizard aggregate this performance data by store and time period automatically, so a coordinator managing hundreds of monthly events can spot trends without manually pulling spreadsheets together.
That ongoing view should directly shape which stores, time slots, and ambassador teams get repeat bookings. If a location consistently drives strong sales velocity on weekend mornings but falls flat midweek, shift future bookings accordingly rather than running a flat schedule everywhere.
Food and beverage demos add a layer of nuance: perishables and tasting-based samples depend on freshness and restock timing, so a strong store can underperform simply because product sat out too long or stockouts hit mid-shift. Factor that into how you read the numbers store to store, not just ambassador performance.

Faster conversion from sample to purchase means a demo is working while the shopper is still standing at the display, before attention and intent fade. Products featured in retail and in-store demos often sell over 40% better than non-sampled items [5], and that lift depends on shoppers acting quickly rather than planning to buy the item "next time." For retailers, fast-converting demos also translate into visible register activity during the activation window, which strengthens the case for repeat bookings.
Published benchmarks vary widely by category, format, and demo type, so there is no single industry-standard number. Fortune 100-level in-store demo programs have reported 30-60% conversion lift on demo-attended purchases [1], while broader retail sampling data points to sales gains exceeding 40% versus non-sampled products [5]. Brands should treat these as directional ranges, not fixed targets, and track their own store-by-store results instead of assuming a universal benchmark applies to every SKU or aisle placement.
Not directly, store format, foot traffic, and placement all change the baseline, so raw conversion numbers from a club store and a regional grocer aren't apples to apples. A roadshow near a checkout line will naturally convert faster than a single-ambassador table in a back aisle. Comparisons are more useful when normalized by traffic volume, dwell time, and placement type rather than compared as flat percentages.
No, engagement and conversion are different metrics, and a demo can attract a crowd without converting many of them to buyers. A table that samples 200 shoppers but converts 15 is performing worse than one that samples 60 and converts 25. Tracking units sold per interaction, not just foot traffic, is what actually reveals velocity.
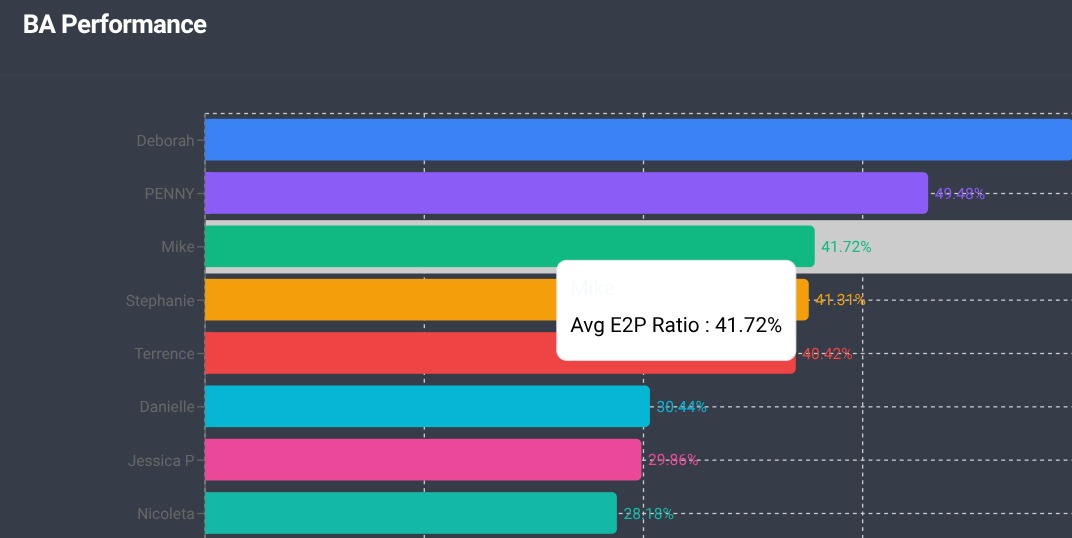
Sales velocity in the demo aisle comes down to three things: how fast a shopper moves from sample to cart, how quickly a brand can identify which stores and time slots drive that speed, and how fast a coordinator can act on that data before the next campaign. Spreadsheets and manual scheduling slow all three. Platforms like Demo Wizard address this by pairing scheduling and ambassador management with post-demo analytics, so a coordinator can see which locations convert fastest and rebook those slots without waiting on a monthly report.
Start by pulling conversion data from your last three demo campaigns and ranking stores by speed-to-purchase, not just total units sold.
Explore more from our content library:
About the Author
Written by the SaaS / Retail Marketing Technology experts at Demo Wizard. Our team brings years of hands-on experience helping businesses with SaaS / Retail Marketing Technology, delivering practical guidance grounded in real-world results.
Demo Wizard is the Ultimate Store Sampling & Demonstration management software for Brick and Mortar Retailers and CPG Vendors.
Chat with usPhone