
Demo Wizard is the Ultimate Store Sampling & Demonstration management software for Brick and Mortar Retailers and CPG Vendors.
Chat with us

Phone
Copyright © 2026 Demo Wizard
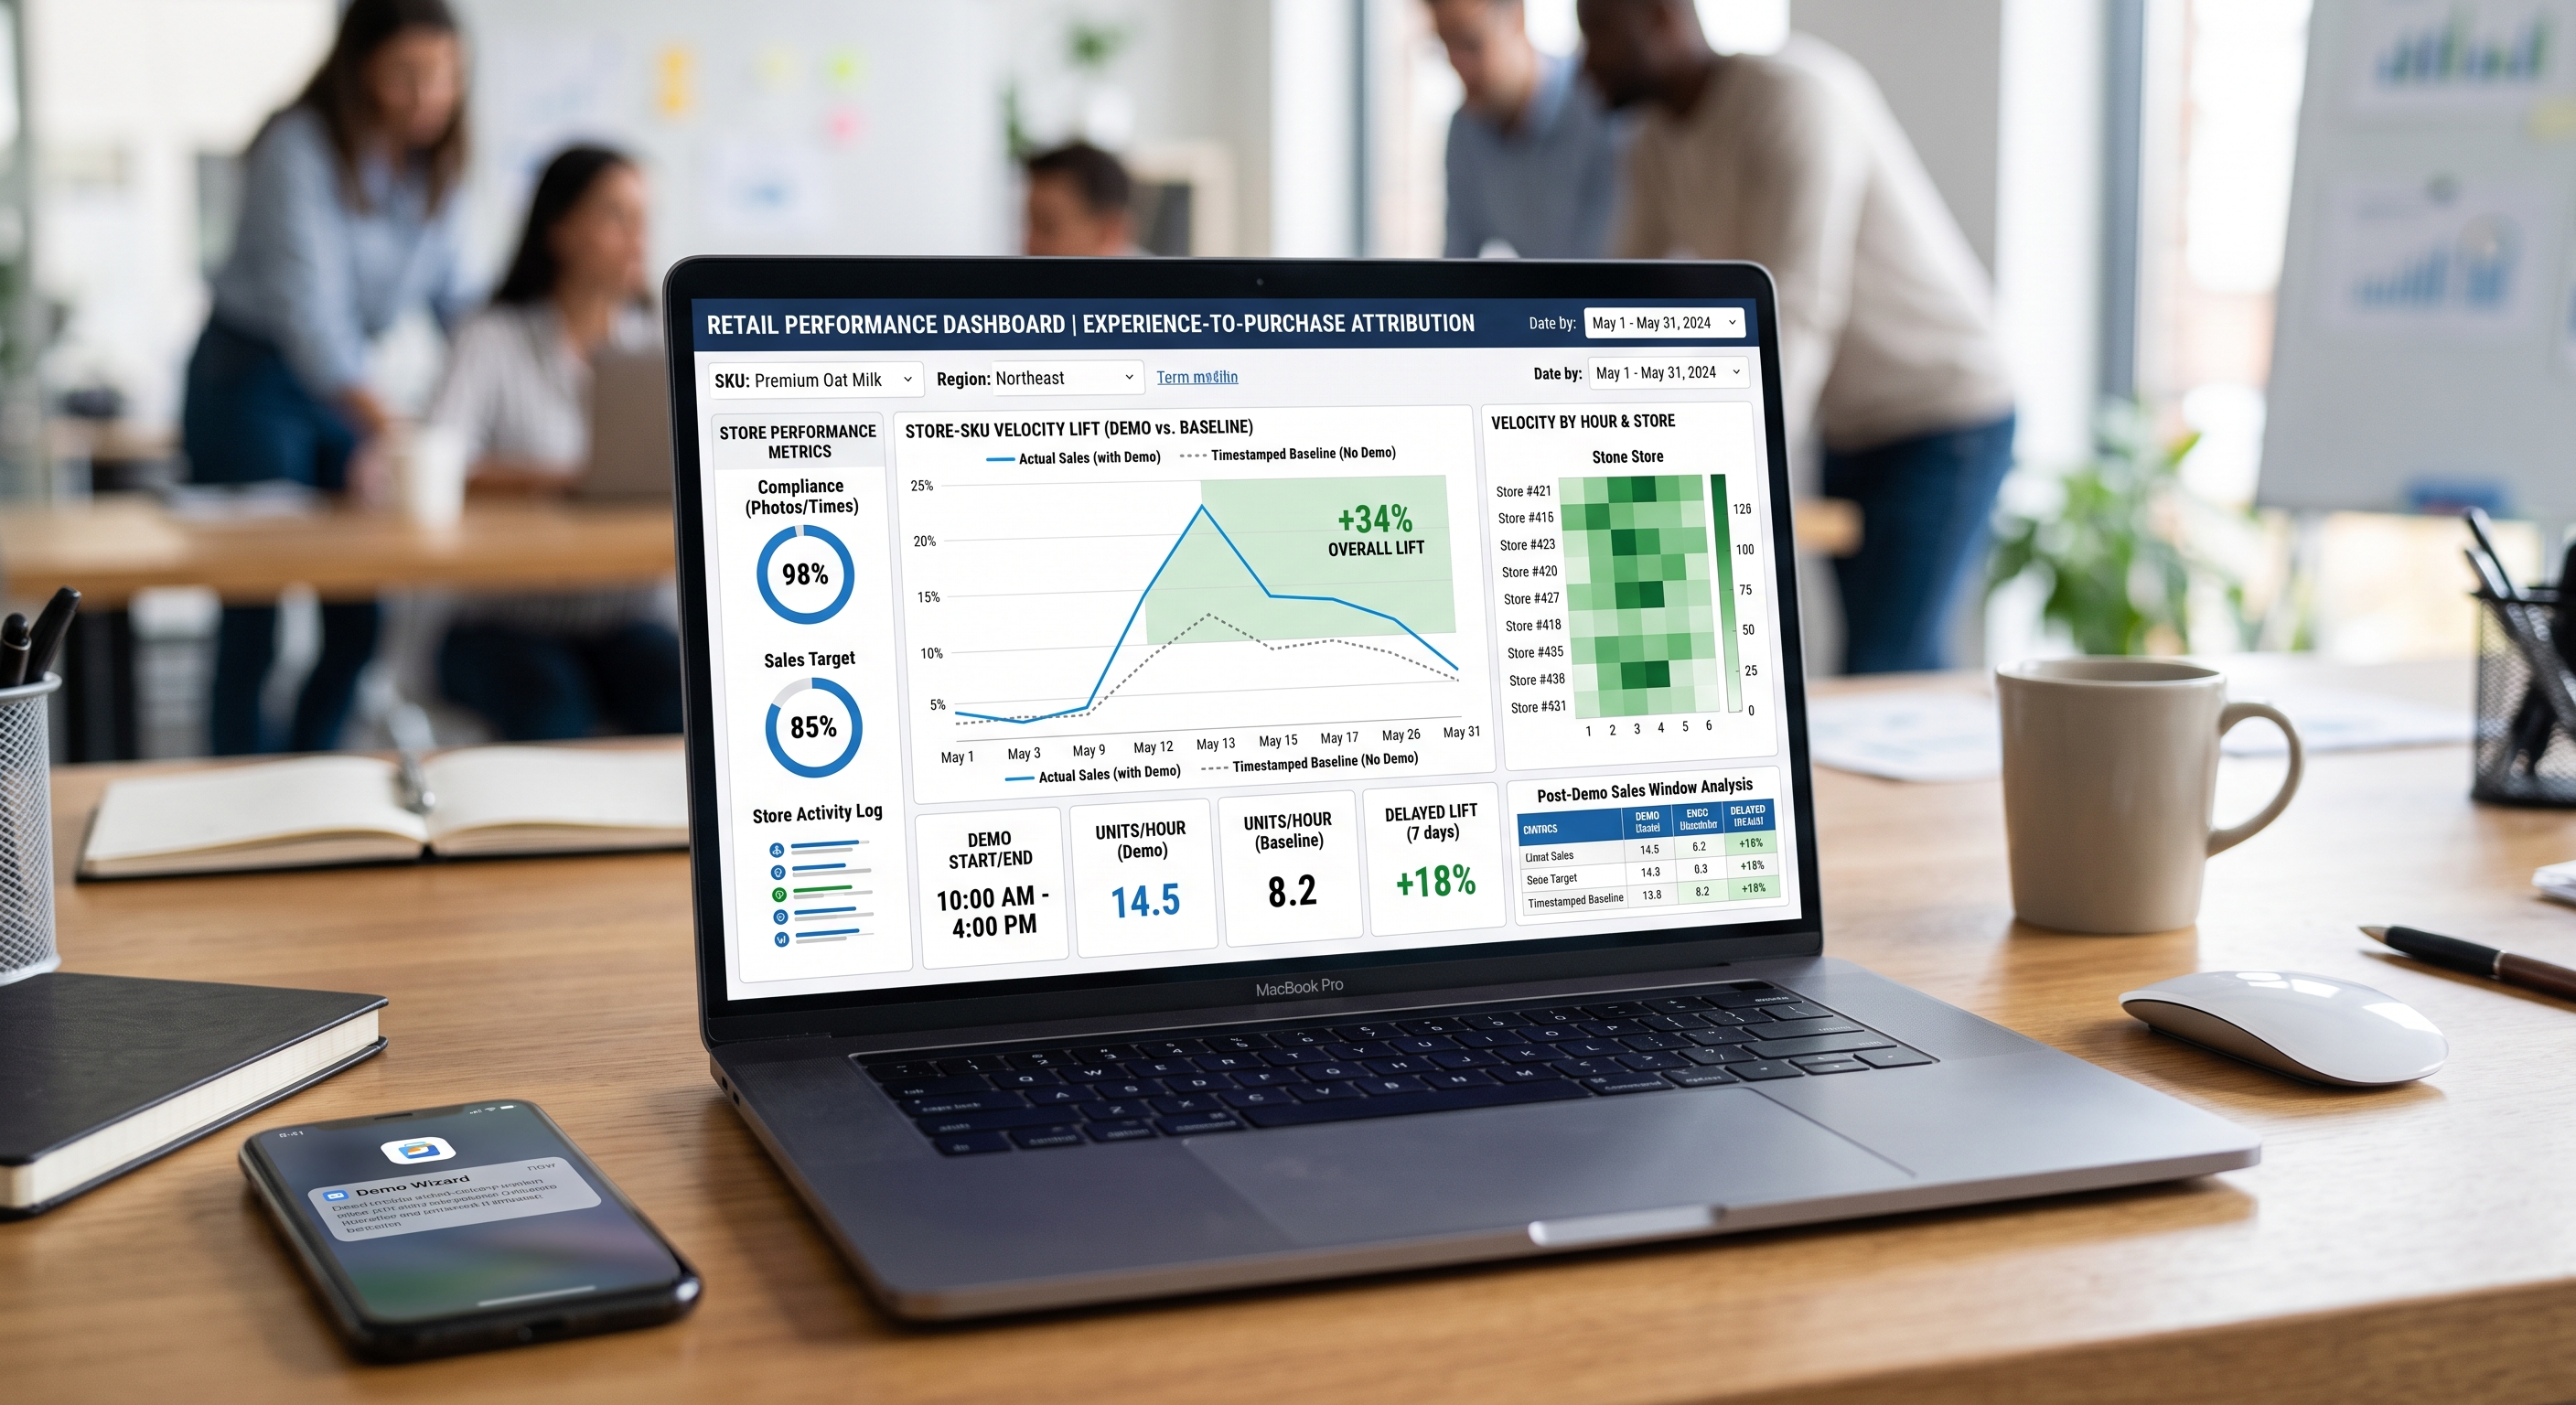
Understanding experience-to-purchase attribution is essential. You connect a demo to a purchase by linking three time-stamped data points: when a brand ambassador engaged a shopper, what happened during that interaction, and the shelf sales velocity in the hours and days that followed at that specific store. Because shoppers rarely buy at the exact moment they sample a product, this relies on comparing demo-day and post-demo sales against a baseline period for the same store and SKU, rather than tracking an individual shopper's path the way digital ads do. The tighter the timestamped record of the demo itself, the more confidently a brand can isolate its effect on velocity from other variables like pricing or promotions.

You measure impact by comparing shelf velocity before, during, and after the demo window against a baseline period, not by counting how many people showed up.
Most brand activation managers already collect plenty of numbers from a demo day. The problem is that most of those numbers describe activity, not outcome. Getting experience-to-purchase attribution right means separating the two categories and treating only one of them as proof.
Foot traffic, sampling counts, and dwell time are engagement metrics, they tell you the demo happened and shoppers stopped to interact. They don't tell you whether anyone bought the product. A table that sampled 300 shoppers on a Saturday looks impressive on a recap sheet, but if shelf velocity for that SKU didn't move, the campaign didn't do its job.
Units sold per hour during the demo window, and velocity lift versus baseline in the days following, are outcome metrics. These are the numbers that connect a brand ambassador's engagement to an actual purchase decision. Sampling counts and attendance are inputs; velocity lift is the output a finance team or retail buyer actually cares about. In short, a useful experience-to-purchase attribution report typically includes:
The standard baseline method pulls POS data for that store and SKU during the demo period, then compares it against a comparable non-demo period, same store, similar day-of-week and season, no other promotions running. The difference between the two is the closest thing to a clean read on what the demo contributed.
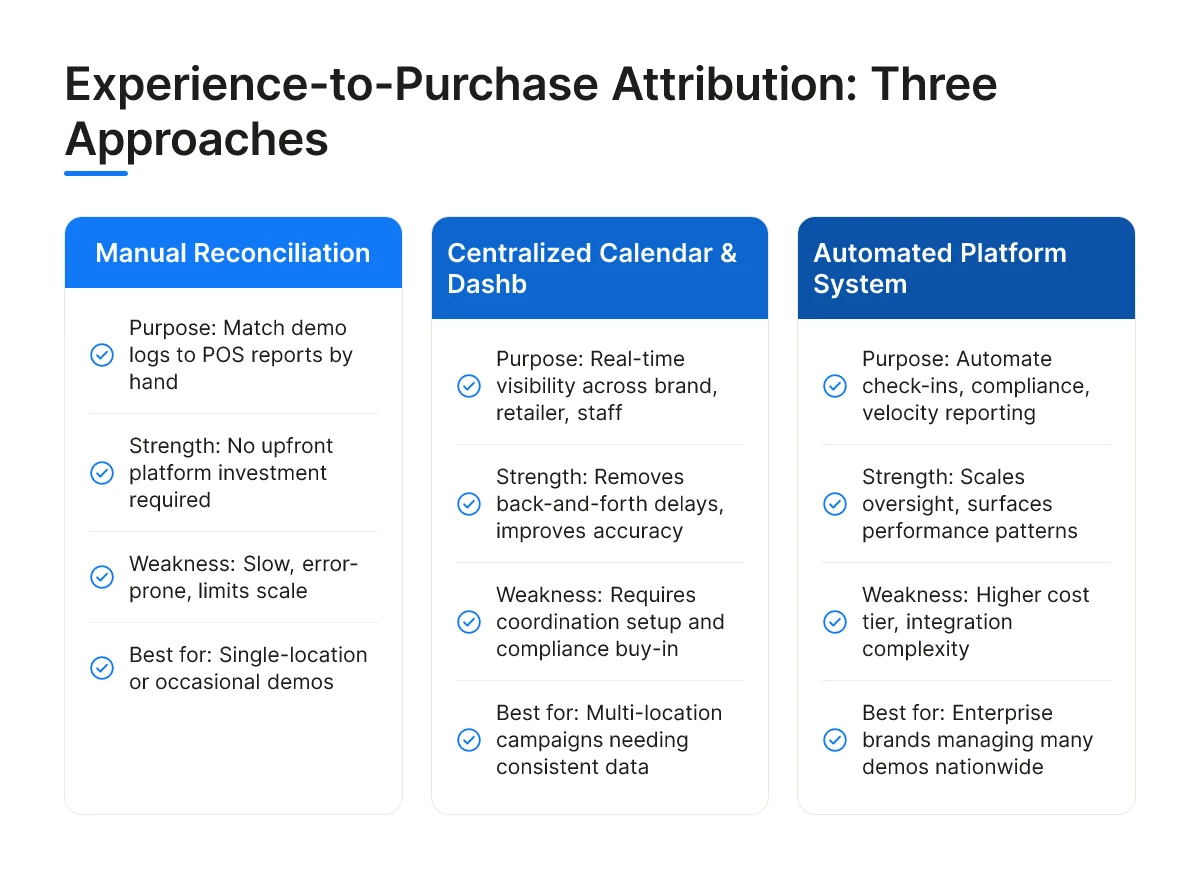
In practice, this comparison is done by hand. A brand activation manager exports POS reports, cross-references them against a spreadsheet of demo dates and store numbers, and tries to line up timestamps that were never designed to match each other. It's slow, and a mismatched date or an SKU typo throws off the whole comparison. Without a shared system of record connecting the demo schedule to the sales data, reconciliation happens weeks after the campaign, when the conversation with the retailer has already moved on. Demo Wizard addresses this gap directly by pairing scheduling data with post-demo analytics, so velocity lift by store and time period is available without a manual reconciliation project.
A demo check-in proves an ambassador showed up and worked a shift; it says nothing about whether the shopper standing at the table bought anything afterward. That gap is the entire problem experience-to-purchase attribution has to solve.
Most retail activation reporting stops at the first fact: demo happened, samples distributed, hours logged. None of that confirms a sale. The ambassador's check-in is an operational record, not a sales record, and treating the two as equivalent is where most brand teams get their ROI math wrong.
Digital attribution works because every touchpoint carries an identifier. A click is tied to a cookie, an account, or a device ID, and that same identifier shows up again at checkout [2]. The chain from touchpoint to conversion is data, not inference. Different attribution models in digital marketing, first-touch, last-touch, and multi-touch, all still rely on that identifier to reconstruct a path [3].
In-store demos have no equivalent thread. A shopper who samples a product and buys it ten minutes later at the register doesn't scan a code that links the two moments. Retail activation has no cookie. Experience-to-purchase attribution has to work around that absence rather than solve it the way digital attribution models do [1].
The physical sequence explains why the gap exists. An ambassador engages a shopper at the display, the shopper samples the product or hears a short pitch, and then one of two things happens: the shopper buys immediately from the display pallet, or they walk the aisle, keep shopping, and decide later, if at all.
That second path is invisible to anyone standing at the table. The purchase decision might happen five minutes later at a shelf on the other side of the store, or three days later on a repeat trip. Nothing at the demo table captures that.
Without precise demo timestamps and store-level location data, brands cannot even run the fallback measurement: comparing store sales velocity in the hours the demo ran against the hours it didn't. That before/after comparison is the substitute for individual tracking, and it only works if the underlying schedule data is accurate to the store and the hour.
You connect the two by anchoring exact demo start and end times, by store and SKU, to point-of-sale velocity data for that same store and SKU, then comparing the activation window against a baseline period. Without that anchor, experience-to-purchase attribution is a guess dressed up as an insight.
A demo that isn't timestamped down to the hour is nearly useless for velocity comparison. If a coordinator only knows a sampling event happened "sometime Saturday," there's no way to isolate its effect from weekend foot traffic, a competing promotion, or a price change that hit the shelf the same day.
Precise start and end times, matched to store number and SKU, let a brand isolate the activation window and measure units sold per hour against a pre-event baseline. This is the mechanical core of experience-to-purchase attribution: without a clean time boundary, there's no clean before-and-after to compare.
A roadshow's multi-day footprint makes this easier, not harder. Because the display, staging, and bundled inventory stay in place for several days rather than a single afternoon, the velocity signal spans a wider window and shows up more clearly against normal store noise than a single two-hour tray-sampling session ever could.
Same-day sales data alone understates a demo's real impact, because plenty of shoppers taste a product Saturday and buy it on their next trip, not before they leave the store. Capturing that delayed lift requires extending the observation window well past the event's closing hour, often by a week or two, and comparing that extended window to the same store's typical sales pattern outside promotional periods.
This is where bundled and exclusive roadshow offers help rather than complicate things. When a brand sells a variety pack or bulk size only during the activation, every unit of that SKU sold in the following weeks traces back to the event, since it wasn't available on the shelf before or after. That exclusivity turns a noisy attribution problem into a much cleaner one, and it's a large part of why roadshow-style activations produce more defensible experience-to-purchase attribution data than routine sampling ever will.
Reliable experience-to-purchase attribution rests on six fields captured the same way, every time:
Miss any one of these consistently and the resulting sales-lift numbers become guesswork rather than evidence.
None of these fields is exotic. Most CPG brands already collect versions of them somewhere, a scheduling spreadsheet, a distributor's delivery log, a retailer's POS export. The problem is rarely data availability; it's data consistency. A demo tracked to the minute at one store and only to the day at another makes any comparison between the two meaningless.
Coordination breaks down whenever brand ambassadors, retailer staff, and distributors work from separate calendars instead of one shared source of truth. A distributor delivers inventory a day early, the retailer reassigns the demo table without telling the ambassador, and the ambassador shows up to find the wrong SKU staged or no stock at all.
Each of those gaps corrupts the underlying data before analysis even starts. A late arrival shrinks the actual demo window below what was scheduled; a wrong-SKU setup means the sales lift you're measuring belongs to a different product than the one recorded. Demo Wizard addresses this by giving brands, ambassadors, and store contacts a single scheduling and check-in system, so the "scheduled" and "actual" fields in the data set reflect what happened rather than what was planned three weeks earlier.
Retailers increasingly require proof of setup: a photo showing branded signage in place, confirmation the table sat in the agreed footprint, and a timestamp showing the demo ran within its approved window. These requirements exist because retailers have seen too many demos that technically happened but didn't happen the way the brand promised, wrong aisle, wrong hours, no signage.
Inconsistent compliance undermines the entire attribution effort. If you can't confirm a demo ran where and when it was supposed to, you can't credibly isolate its effect from ordinary store traffic or a competing promotion nearby. Centralizing compliance confirmation alongside scheduling and sales data removes the back-and-forth between store employees and vendors that otherwise delays record-keeping, and often distorts it, since details relayed secondhand days later rarely match what actually occurred on the floor.
Scaling experience-to-purchase attribution across dozens or hundreds of stores requires replacing spreadsheets and phone check-ins with one centralized system that everyone can see at once.
A coordinator running 30 demos a month by spreadsheet spends most of the week chasing photos, texting ambassadors to confirm arrival, and calling store managers to check whether the display made it to the floor. Every store adds another thread of emails, another file to reconcile, another chance for a missed compliance check to slip through unnoticed.
A centralized calendar and dashboard changes the shape of that work. The brand, the retailer, and the demo staff all look at the same schedule and the same results in real time, instead of three separate versions assembled after the fact. That shared view is what makes experience-to-purchase attribution possible at scale, without it, a brand is comparing incomplete, inconsistently timed reports rather than real velocity data.
The administrative load, not the demos themselves, is usually what caps how many activations one person can run. Automating check-ins, compliance confirmation, and reporting removes the manual reconciliation step entirely, ambassadors log arrival and setup through the platform, and the data flows into a dashboard without a coordinator re-entering it by hand.
With that burden gone, the same coordinator can compare velocity lift across stores and campaigns side by side. Patterns that used to take weeks to notice, a regional chain that consistently outperforms, an ambassador team with stronger close rates, a weekday slot that beats weekends, surface directly in the data instead of anecdotally.
Platforms in this category span a range of qualitative tiers. Budget-friendly tools cover basic scheduling; mid-range and enterprise options add the compliance tracking, payroll integration, and cross-location analytics needed to run experience-to-purchase attribution at real scale. Demo Wizard prices per demo rather than per user or per location, so a brand running hundreds of monthly events doesn't pay more just for growing its footprint.
Yes, demo ROI relies on store-level sales lift, not shopper identity. Compare unit velocity at the demo store during and after the event against a baseline period or a control store that didn't run a demo. This store-and-time-window approach is how most CPG brands and retailers already measure activation impact, since tracking individual shoppers isn't part of how in-store demo tools work.
Watch sales data for at least seven to fourteen days after the demo to capture delayed purchases. Some shoppers try a sample on Saturday but don't buy until their next full grocery trip. A single-day snapshot will understate the true lift, especially for higher-priced or less frequently purchased items.
Generally yes, a multi-day roadshow generates more consistent, higher-volume data than a one-off sampling session. Running for three to ten days across varied shopper traffic patterns (weekday versus weekend) smooths out anomalies and makes the sales lift easier to isolate from normal week-to-week fluctuation.
Inconsistent data collection across stores is the most common cause, missing check-in times, incomplete unit counts, or ambassadors reporting on paper instead of a shared system. Without standardized, centralized reporting, brands end up comparing incomplete records rather than real performance.
Not quite. Traditional marketing attribution models trace a digital path across multiple touchpoints using identifiers like cookies or account logins. Experience-to-purchase attribution borrows the same underlying logic, connect an interaction to a downstream sale, but applies it in a physical retail setting where no individual identifier exists, so it relies on store-level timing and velocity comparisons instead.
Proving that an in-store demo drove sales comes down to three things: a clean baseline, a wide enough sales-tracking window, and consistent data collection across every store running the activation. Skip any one of these and the ROI number you report to finance or a retail buyer won't hold up.
Brands that centralize scheduling, ambassador check-ins, and post-demo sales data in one system spend less time reconciling spreadsheets and more time acting on which stores and time slots actually convert. Demo Wizard builds this into its scheduling and analytics workflow, so a single coordinator can track experience-to-purchase performance across hundreds of monthly events. Start by pulling sales data from your last three demo events and mapping it against a same-store baseline, the gaps in that comparison will show you exactly where your reporting needs to improve.
Explore more from our content library:
About the Author
Written by the SaaS / Retail Marketing Technology experts at Demo Wizard. Our team brings years of hands-on experience helping businesses with SaaS / Retail Marketing Technology, delivering practical guidance grounded in real-world results.
Demo Wizard is the Ultimate Store Sampling & Demonstration management software for Brick and Mortar Retailers and CPG Vendors.
Chat with usPhone