
Demo Wizard is the Ultimate Store Sampling & Demonstration management software for Brick and Mortar Retailers and CPG Vendors.
Chat with us

Phone
Copyright © 2026 Demo Wizard

Demo incrementality measurement isolates the actual sales caused by an in-store product demonstration from baseline sales that would have happened anyway due to weekend traffic, seasonality, or existing promotions. Because CPG brands rarely have access to retailer point-of-sale (POS) data, they rely on post-demo conversion rates (samples given vs. units bought) as their primary causal signal, using a 10% conversion benchmark to spot store-fit or execution issues rather than blindly chasing topline sales bumps.
Demo incrementality measurement is the practice of isolating how many sales a product demonstration actually caused, versus units that would have sold anyway. Brands and demo companies do this primarily through demo conversion rate (samples given versus units purchased at the demo), captured in the post-demo report, since they typically lack access to a retailer's register data. Retailers, who do own point-of-sale data, look instead at sales velocity and basket size during the demo window compared to a non-demo baseline. This distinction matters because a rise in total sales can reflect normal store traffic or seasonality, not the demo itself.
Demo incrementality measurement separates sales the demo actually caused from sales that would have happened anyway, regardless of whether a brand ambassador showed up that day.
A Saturday afternoon demo table in a busy store will almost always coincide with a sales bump. The question is whether that bump is incremental lift, units sold because a shopper tasted the product and decided to buy, or coincidental lift, units that would have sold anyway because of weekend foot traffic, a seasonal spike, or a retailer promotion already running on that SKU. Confusing the two is the most common error in reading demo performance.
Total sales growth alone can mislead a brand into repeating a demo in a store where the lift had nothing to do with the ambassador at the table. A store running a 20%-off coupon that same weekend, or a location with naturally heavy Saturday traffic, will show a sales increase whether or not the demo happened, and a brand reading only the topline number will draw the wrong conclusion about where to invest next.
This is why CPG brands and the demo companies and brokers that staff these events lean on demo conversion rate, samples given versus units purchased at the table, captured in the post-demo report, as their primary signal. They typically have no access to a retailer's point-of-sale system, so the post-demo report is the most direct causal read available to them [4]. Retailers sit on the opposite side of that data gap. They own POS data and track sales velocity and basket size during the demo window against a non-demo baseline, which is closer to a true incrementality read but says nothing about what happened at the table itself [1][2]. These two data sets, demo conversion on one side, register data on the other, rarely get combined across the brand-retailer relationship, so each party measures incrementality through its own lens rather than a shared one.
Knowing the real, isolated lift changes three decisions: where to repeat activations, which stores match the shopper demographic for that product, and where to pull spend from stores that looked good on paper but weren't actually converting. A brand running Demo Wizard's post-demo analytics across dozens of weekly activations can compare conversion rate by store and time slot, rather than guessing from a sales chart that may be shaped by factors the demo never touched.
Without that isolation, brands risk optimizing toward stores and events, not causes, paying for activations that happened to sit near lift, rather than ones that created it.
Demo incrementality measurement combines two data streams: the brand's demo conversion rate and the retailer's sales velocity, compared against a baseline for the same store and SKU.
Neither number alone proves incrementality. A brand that tracked only samples handed out would miss whether those samples turned into purchases that wouldn't have happened anyway. A retailer that tracked only total sales would miss whether the demo itself caused the bump or whether foot traffic was simply heavier that day. Getting a usable answer means pairing both.
On the brand or agency side, the core metric is demo conversion rate: samples distributed against units bought during the demo window, pulled straight from the post-demo report. A brand ambassador logs how many shoppers tried the product and how many walked it to the register during the shift, and that ratio becomes the clearest signal available without retailer POS access.
On the retailer side, the real incrementality signal is sales velocity: units sold per day for that SKU, compared against a pre-demo baseline or against non-demo days at the same store. Retailers own this data and can build a clean before/after comparison because they see every transaction, not just the ones that happened in front of an ambassador.
Brick-and-mortar doesn't lend itself to the randomized control groups used in digital campaigns [4], but two practical stand-ins work well. The first is a same-store before/after window, compare the week of the demo against the prior week or the same week a month earlier. The second is a comparable-store comparison, pick a nearby location with similar shopper demographics and no demo running, and use its sales as a rough control. Neither is perfect, but together they approximate the treatment-versus-control logic that incrementality testing relies on in other channels [5].
Raw sales lift during a demo window can be misleading because it's easy to confuse a sales bump with a demo effect when other factors are driving traffic [2]. Weekend foot traffic alone can lift a SKU's velocity well above a Tuesday baseline with no demo involved. Holiday shopping surges, local weather that keeps or draws shoppers into a store, and a concurrent price promotion or end-cap display can all inflate sales independent of the demo.
The practical fix is to match the comparison window as closely as possible: compare a Saturday demo against a prior Saturday, not a Tuesday, and flag any overlapping promotions so they can be factored out of the read. This is the same discipline promotion-effectiveness analysis uses to separate a genuine lift from a sale that just pulled forward purchases shoppers would have made anyway [3].
Brands should treat their sales velocity figure as an estimate, not a hard number, since they don't have direct POS access and are often relying on rough retailer reporting or shelf checks. Retailers, in turn, have no visibility into demo conversion rate at all, they see what sold, not how many samples it took to sell it. Each side sees half the picture, which is why demo incrementality measurement works best when brands and retailers treat their respective metrics as complementary rather than interchangeable.

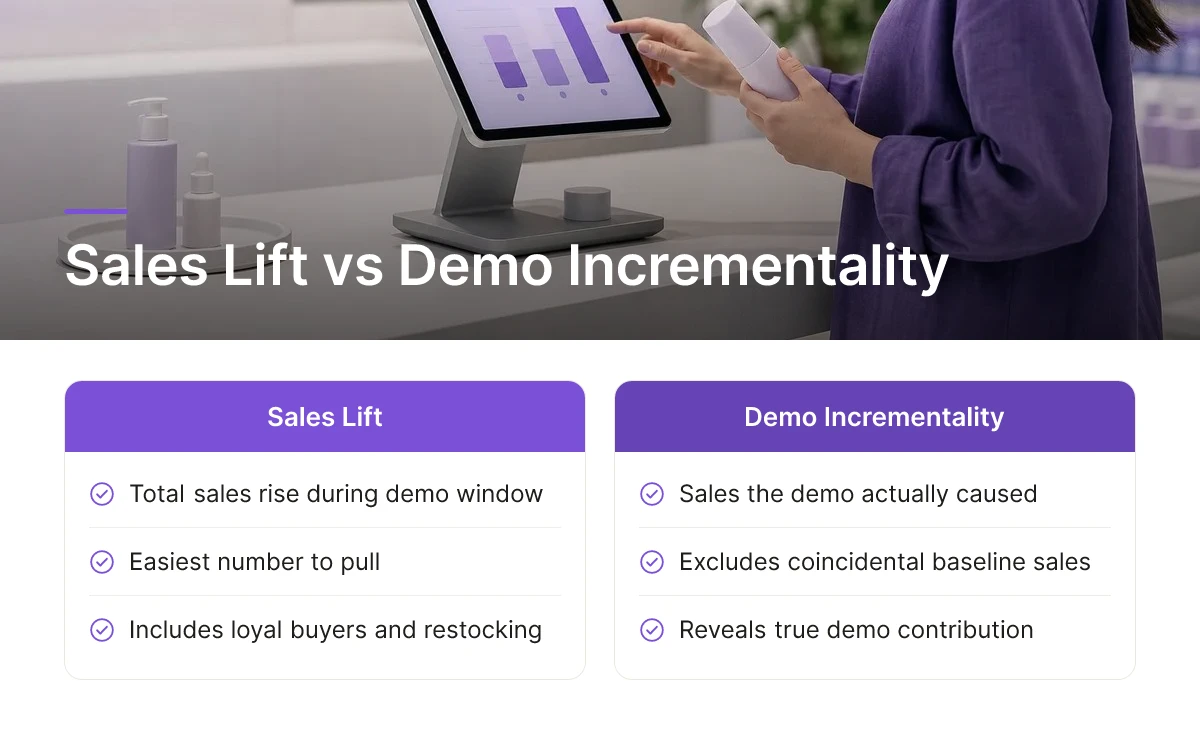
Sales lift tells you total sales rose during a demo window; demo incrementality measurement tells you how much of that rise the demo actually caused versus sales that would have happened anyway.
Overall sales lift is the easiest number to pull and the easiest one to misread. If a store sells 40% more units of a product during a Saturday demo, that figure includes shoppers who were already loyal buyers, shoppers who were going to grab that item regardless of a sample table, and shoppers who happened to be restocking that week. None of that is demo-driven. Treating the full lift as the demo's contribution overstates its impact and can lead a brand to keep funding activations that are riding on baseline demand rather than creating new demand.
Store conversion rate, the ratio of samples given to units purchased at that location, is useful for one thing: telling you whether the shopper base at that store fits the product being demonstrated.
A high samples-to-sales ratio at a particular store suggests the demographic walking through that aisle matches the product. That's valuable for deciding where to focus future activations and ad spend. But it is not a revenue number, and it doesn't quantify incremental lift. A brand can hit a strong conversion rate at a store with low foot traffic and still generate less incremental revenue than a mediocre conversion rate at a high-traffic store. Conversion rate answers "is this the right shopper," not "how many sales did we create that wouldn't have happened otherwise."
For retailers, sales velocity remains the primary lift metric in brick-and-mortar, it reflects actual units moved off the shelf over time, measured through their own point-of-sale data. Store conversion rate sits alongside velocity as a secondary, demographic-fit signal that helps retailers and brands decide where to double down, not a replacement for it.
Digital marketing can trace a click to a purchase because there's a logged touchpoint. In-store demos have no equivalent path, a shopper who samples a product and buys it twenty minutes later, or the next week, leaves no digital trail connecting the two events [4]. Attribution-style thinking, borrowed from digital channels, assumes a traceable journey that physical retail simply doesn't produce [5]. This is why demo incrementality measurement for brick-and-mortar leans on comparison rather than tracing: demo-day sales against a control period, or conversion data from the post-demo report against baseline. It's also why brand-side and retailer-side KPIs diverge. Brands and demo agencies, lacking POS access, track demo conversion rate, cost per sample, and repeat purchase rate from their own post-demo reporting. Retailers, who own the POS data, track sales velocity and basket size. The two rarely get combined into one dataset, which is why each audience needs its own measurement frame rather than a single borrowed metric.
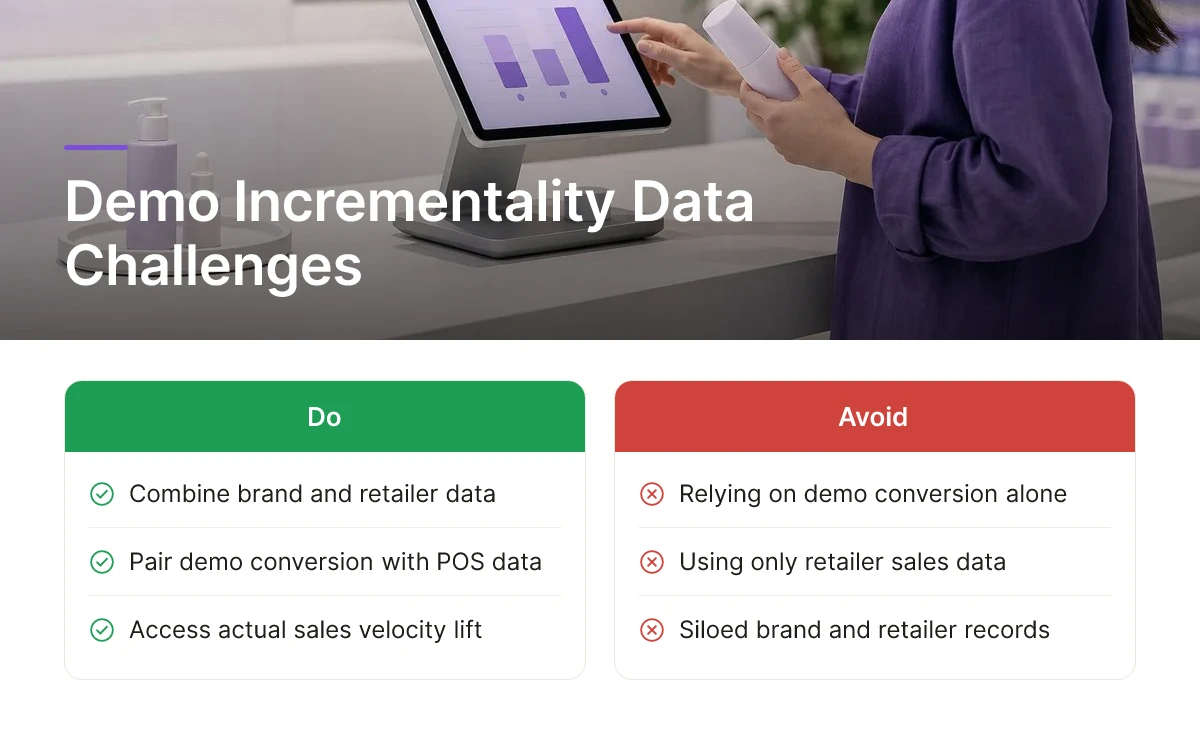
The biggest obstacle is structural: brands and retailers each hold half the data needed, and they rarely combine it into one picture.
A brand running a sampling campaign can see demo conversion rate, how many samples turned into on-the-spot purchases, captured in the post-demo report. What the brand cannot see is the store's actual point-of-sale data: total units sold that day, basket size, or whether sales stayed improved after the ambassador packed up. The retailer holds that POS data and owns the real incrementality answer, sales velocity lift, but has no visibility into demo conversion, since that number only exists on the brand's side of the table. These two data sets rarely get reconciled, because brands and retailers don't typically share systems or reporting cadences. That gap is why demo incrementality measurement usually means something different depending on which side of the table you're sitting on, and why a brand should treat its own demo conversion rate as the honest, measurable KPI rather than guessing at retailer sales data it doesn't have access to.
Treat any single demo as a data point, not a verdict, store traffic, staffing, weather, and competing promotions shift enough from week to week that one event rarely tells the full story.
A Saturday afternoon slot near the entrance will outperform a Tuesday morning slot in the back aisle regardless of how good the product is. A new brand ambassador's first shift will likely convert differently than their tenth. Generalizing from one demo at one store risks drawing the wrong conclusion about a product's actual shopper fit. Reliable measurement requires repeating activations across multiple dates and multiple stores, then looking at the pattern rather than any single result.
That repetition takes time and discipline, not a data science team. Brands that measure demo incrementality well typically run activations over several weeks and insist on consistent post-demo reporting from every ambassador shift, same fields, same detail level, every time. Without that consistency, comparing one week's results to the next becomes guesswork. Platforms like Demo Wizard address this by standardizing post-demo reports and aggregating performance by store and time period, so a coordinator can spot patterns across dozens of events without manually compiling spreadsheets.
Shopper comments inside those reports matter more than the conversion number alone. A demo conversion rate below 10% is a flag worth investigating, not proof the product failed, the comments usually explain why: wrong store demographic for the product, an ambassador mismatched to the audience, or a demo station placed too far from the shelf to convert interest into a cart addition.
Consistent demo incrementality measurement depends on standardized data capture, not on better math applied to patchy spreadsheets after the fact.
Most brands running fewer than a handful of demos a month can get by on manual coordination. Once a program scales past that, the cracks show up fast, and they show up in the data first.
Automated coordination replaces scattered phone calls, texts, and spreadsheet tabs with one consistent record of what happened at every demo, every time.
When a brand activation manager coordinates demos through spreadsheets, calls, and texts between the brand, the agency, and the store, the post-demo data that comes back is rarely consistent. One ambassador fills out a detailed recap; another sends a one-line text. One store manager mentions a competing promotion running the same weekend; another doesn't think to flag it. Those gaps don't just create extra admin work, they undermine the comparisons that incrementality analysis depends on. If half the reports are missing shopper feedback or exact timing, a brand can't reliably tell whether a low demo conversion rate reflects a bad store fit or a bad report.
A reliable platform logs the same fields for every single activation: samples distributed, units sold during the demo window, shopper comments, ambassador notes, and the exact store and time slot.
That consistency is what turns individual demo reports into a dataset. When every activation captures the same fields in the same format, a brand can line up demo conversion rate across dozens of stores, several ambassadors, and different day-parts, and start seeing patterns instead of anecdotes. A 6% conversion rate at one chain's weekend slots versus 14% at weekday evening slots is a signal worth acting on, but only if the underlying reports are complete enough to trust.
Demo Wizard centralizes this process for CPG brands, demo companies, and agencies: scheduling across locations, ambassador assignment, and post-demo ROI reporting all run through one system instead of three disconnected ones. It captures the structured detail, samples given, units moved, shopper comments, store and time-slot performance, that demo incrementality measurement requires, without manual follow-up to chase down missing reports.
One clarification worth making directly: Demo Wizard does not ingest or integrate with retailer point-of-sale systems. Its data comes from the demo itself. Brands that want to compare demo conversion trends against broader store sales velocity can still import retailer or third-party sales data separately, that's a manual combination of two data sources, not a built-in integration, and it's worth planning for as a separate step rather than assuming the platform does it automatically.

No, though they're related ideas. A/B testing compares a treatment group against a control group under controlled conditions to isolate cause and effect [4]. Demo incrementality measurement, by contrast, usually compares observed demo-day performance, conversion rate, sales velocity, or engagement, against a baseline estimate of what the store would have sold anyway, since brands rarely run a true controlled experiment at the shelf.
Yes, but only as an estimate, not a precise figure. Brands typically rely on the post-demo report: samples distributed versus units bought at the table, plus ambassador-logged observations. Without POS data from the retailer, true store-level sales velocity stays an approximation rather than a verified number, a limitation brands should state plainly when reporting results internally.
A demo conversion rate above 10% generally signals a well-matched product, store, and ambassador. Below that threshold, something is usually off: the store's shopper demographic doesn't fit the product, the brand ambassador needs coaching, or the demo table sits too far from the shelf to convert sampling into a basket add.
Because each side owns a different half of the picture and has little incentive or system to merge them. Brands see demo conversion from the sampling table; retailers see POS sales velocity and basket size. Data-sharing agreements are uncommon, so most incrementality analysis happens separately on each side.
Incrementality measurement means separating what a demo actually caused from what would have sold anyway. For CPG brands, that starts with demo conversion rate as the primary signal, treating anything below 10% as a prompt to check the store fit, the ambassador, or the table placement rather than writing off the whole campaign. Sales lift estimates fill the gap left by missing POS access, but they're estimates, not verified causality.
The next step: pull your last 90 days of post-demo reports, sort by store, and flag every demo under the 10% threshold for a root-cause review before you schedule the next round.
Explore more from our content library:
About the Author
Written by Gregory Yankelovich. This article was conceptualized, directed, and reviewed by our human team of retail marketing veterans. Every strategy, framework, and recommendation originates from the hands-on expertise of our experts. Human insight drives the core narrative, ensuring all advice remains grounded in real-world retail execution. AI assistance was used to streamline production and optimize for generative engine optimization (GEO).
Demo Wizard is the Ultimate Store Sampling & Demonstration management software for Brick and Mortar Retailers and CPG Vendors.
Chat with usPhone